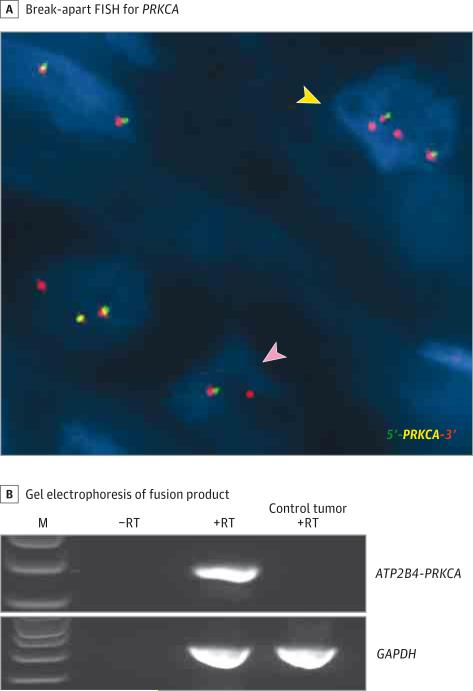
Figure 4. Identification of PRKCA Fusion by Fluorescence In Situ Hybridization (FISH) and Reverse Transcriptase–Polymerase Chain Reaction (RT-PCR).
A, Break-apart FISH for PRKCA shows gene rearrangement with loss of the green signal (pink arrowhead), suggestive of an unbalanced translocation. A subset of cells (yellow arrowhead) shows 1 or 2 extra red signals. B, Gel electrophoresis of ATP2B4-PRKCA RT-PCR fusion product. Amplicon spanning the location of the fusion was observed in the tumor (245 base pairs), but not in the control reactions for which RT was omitted. The amplicon was also absent in a control tumor sample (brain) predicted to be negative for the fusion. Glyceraldehyde 3-phosphate dehydrogenase (GAPDH) primers were included as an internal positive control. The identity of the fusion was confirmed by amplicon sequencing. M indicates 1-kb ladder.

