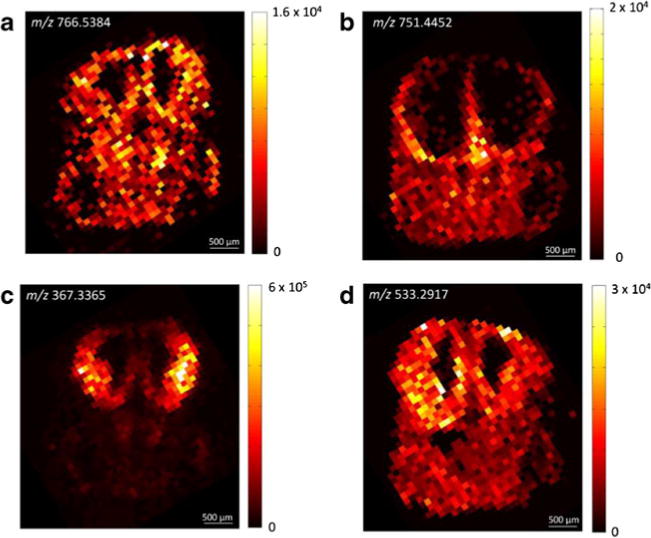
Fig. 2.

IR-MALDESI imaging of coronal sections of an E13.5 embryonic mouse brain. The ion maps show the spatial distribution of a [PC(35:5)+H+]+, b [DAG(38:4)+107Ag+]+, c [desmosterol+H+−H2O]+, and d [lanosterol+107Ag+]+ (cf. text for details on the peak assignment)
