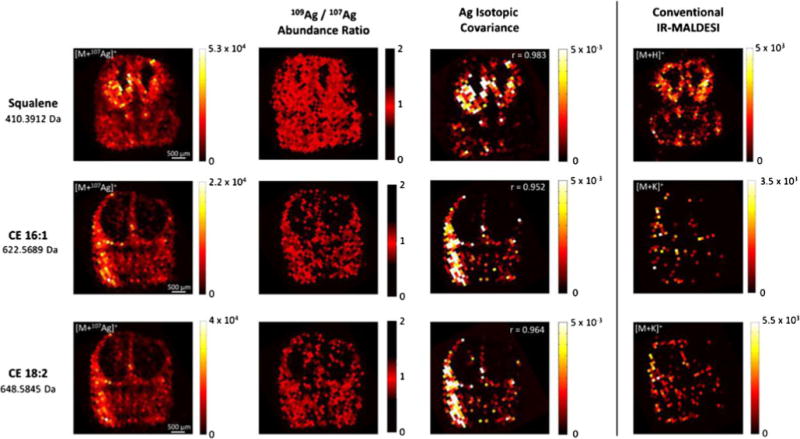
Fig. 3.

Comparison of silver cationization with ion formation under conventional IR-MALDESI imaging conditions. Ion maps of [M+107Ag+]+ species show the spatial distribution of squalene, CE(16:1), and CE(18:2) in coronal embryonic brain sections. Ion abundance ratios close to the theoretical abundance ratio of 0.9291 (NIST Atomic Weights and Isotopic Compositions, version 3.0) and the high spatial correlation of the detected silver isotopes (Pearson correlation coefficients r > 0.95) confirm the formation of Ag+ adducts. Ion maps on the right refer to the most abundant species that were formed using an electrospray solvent composition of MeOH/H2O (1:1)+0.2 % FA
