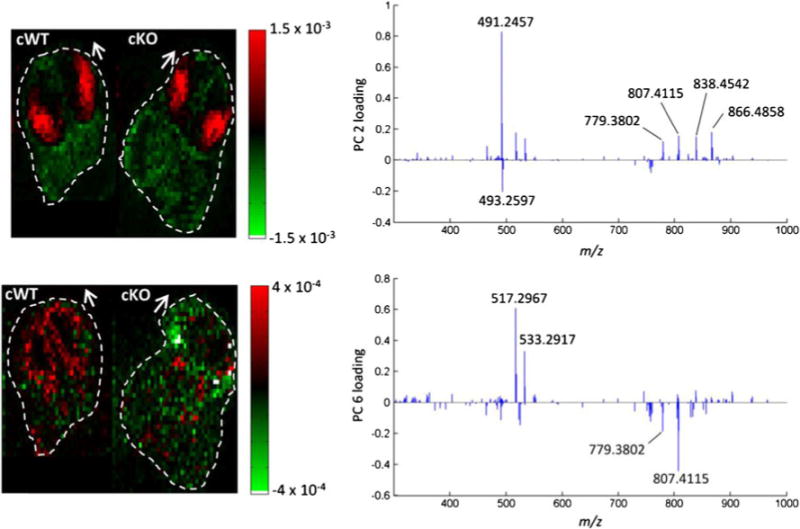
Fig. 6.

Principal component analysis of a concatenated Ag-doped IR-MALDESI imaging dataset of Sp2 cWT and cKO embryonic brain sections. Score plots of principal components 2 (top) and 6 (bottom) indicate mass spectral correlation and anti-correlation between WT and cKO samples. Loading plots on the right visualize the contribution of MS signals to the respective principal components. Dashed lines and arrows indicate the outline and orientation of the tissue sections
