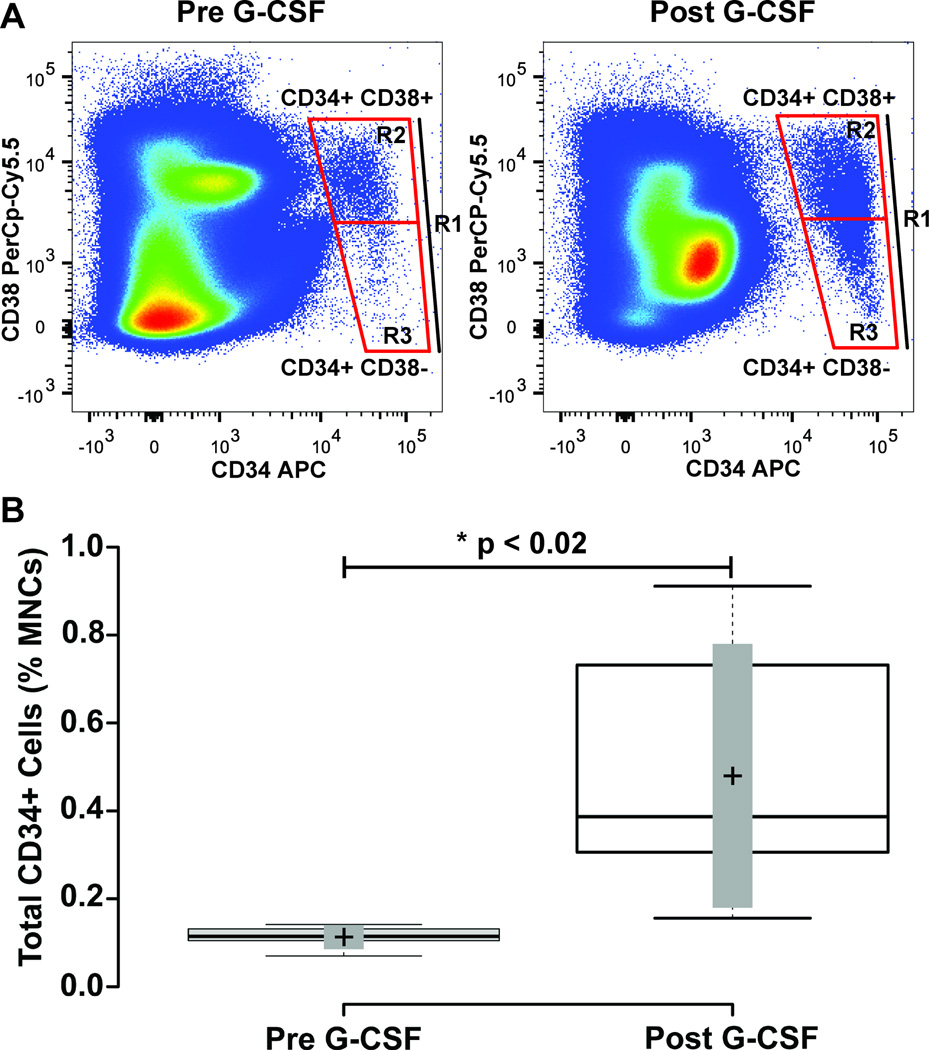
Figure 3. Mobilization of CD34+ Mononuclear Cells with G-CSF Treatment.
Blood mononuclear cells from human subjects were collected before and after four days treatment with G-CSF. Panel A illustrates representative flow cytometry plots revealing CD34+ CD38+ and CD34+ CD38- cell populations in a subject with cell quantities closest to the mean of the study cohort. The labeled boxes shown delineate total CD34+ cells (indicated as R1), CD34+ CD38- (R3) and CD34+ CD38+ (R2) populations. Panel B shows a box-plot that shows the quantity of total CD34+ cells as a percentage of blood mononuclear cells before and after G-CSF treatment. Center lines show the medians; box limits indicate the 25th and 75th percentiles as determined by R software; whiskers extend to minimum and maximum values; crosses represent sample means; bars indicate 90% confidence intervals of the means. n = 6 sample points before and after G-CSF treatment. P-values for the comparison pre and post G-CSF are indicated in the figure.

