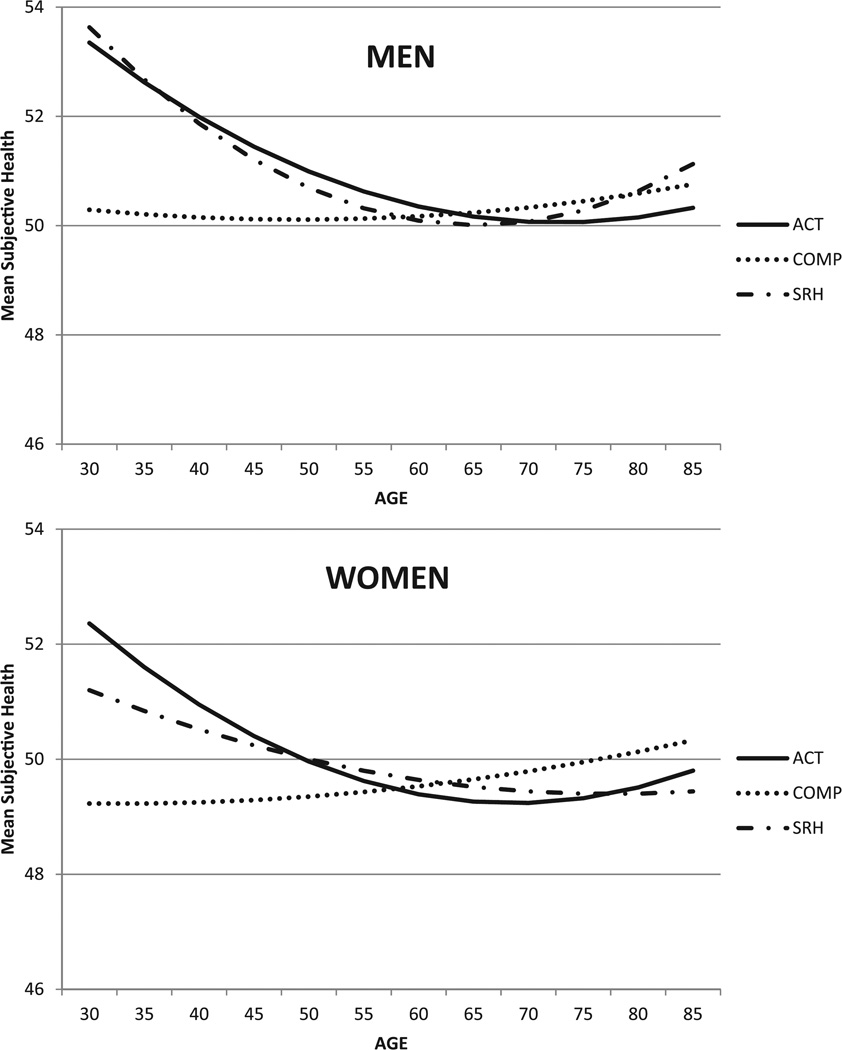
Figure 1.
Mean responses on three measures of subjective health for men and women across adulthood, converted to T-score metric: health limits activities, self-rated health, and health compared to others.
Note. Higher scores indicate perceptions of better health. ACT = activity; COMP = health compared to others; SRH = self-rated health.

