
Figure 2.
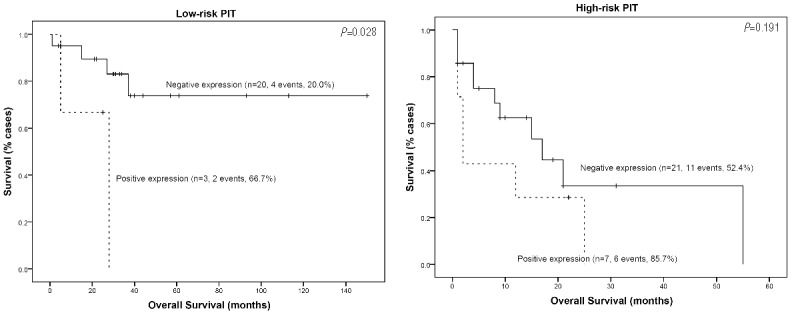
Kaplan–Meier survival curves of C-MYC expression in the AITL subgroup of patients in the low-risk and high-risk PIT subgroups.
Official websites use .gov
A
.gov website belongs to an official
government organization in the United States.
Secure .gov websites use HTTPS
A lock (
) or https:// means you've safely
connected to the .gov website. Share sensitive
information only on official, secure websites.
Kaplan–Meier survival curves of C-MYC expression in the AITL subgroup of patients in the low-risk and high-risk PIT subgroups.