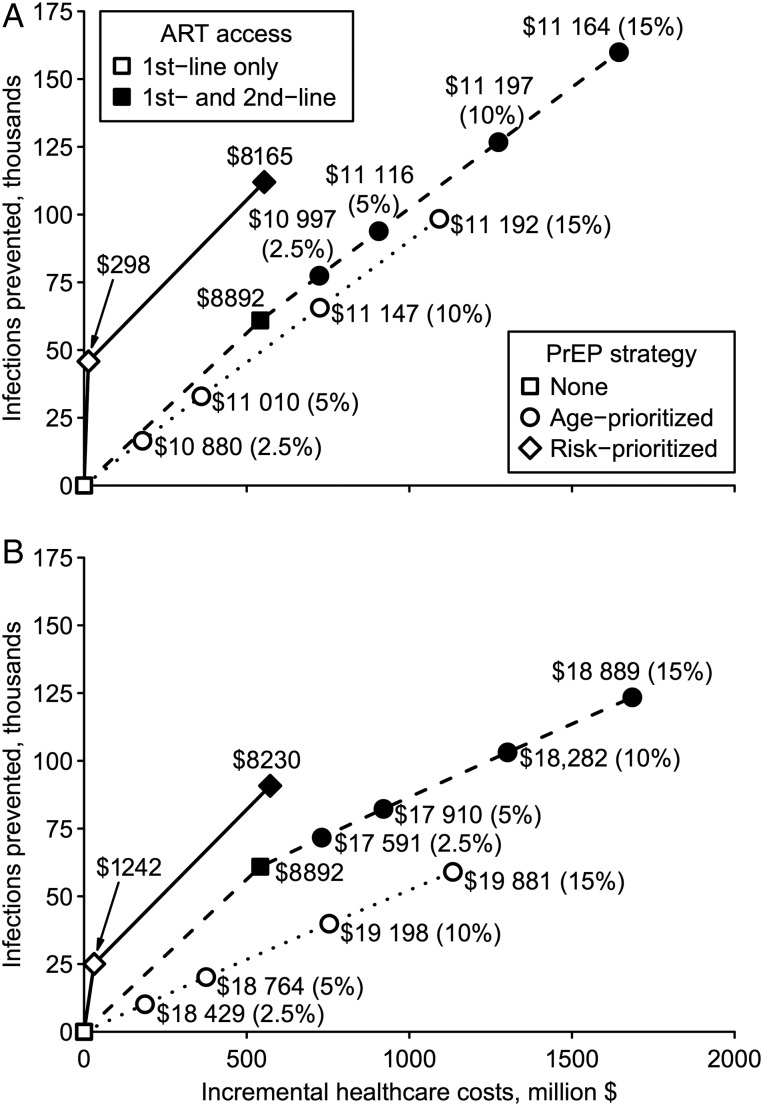
Figure 1.
Cost-effectiveness of preexposure prophylaxis (PrEP) over 10 years. Incremental costs and infections prevented are plotted for each PrEP strategy in optimistic (A) and conservative (B) scenarios. Optimistic (conservative) scenario assumptions are: 90% (70%) PrEP efficacy vs wild-type human immunodeficiency virus (HIV), 0%–50% relative efficacy vs rilpivirine-resistant HIV, 80% (70%) PrEP reliability, 40% (70%) cross-resistance between antiretroviral therapy (ART) and PrEP, and successful (all) PrEP injections select drug-resistant HIV after breakthrough infection. The origin corresponds to the reference scenario without PrEP. Lines correspond to the cost-effectiveness frontiers, labeled with incremental cost per infection prevented relative to the next best strategy. Frontiers are shown for base-case simulations (dotted line), structural sensitivity analysis including second-line ART (dashed line), and risk-prioritized PrEP (solid line). Age-prioritized PrEP coverage levels are stated in parentheses. Interventions not on these frontiers are not shown.

