Figure 3.

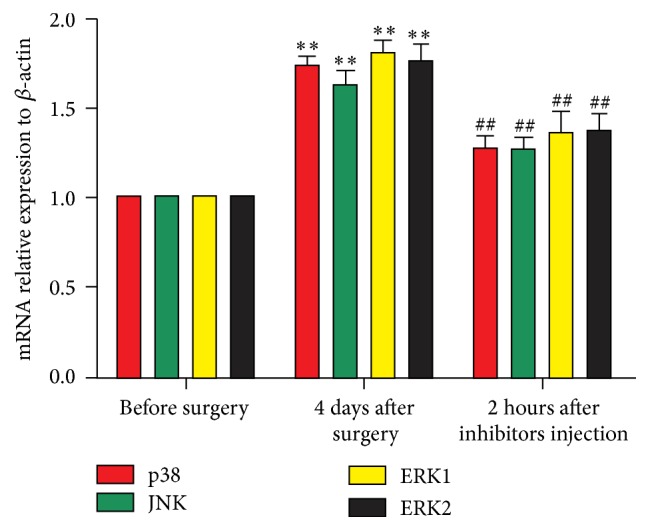
Relative expression levels of p38, JNK, and ERK mRNA in DRGs. n = 6 in each group. ∗ P < 0.05 and ∗∗ P < 0.01 compared with the normal rats. # P < 0.05 and ## P < 0.01 compared with CCD rats.

Relative expression levels of p38, JNK, and ERK mRNA in DRGs. n = 6 in each group. ∗ P < 0.05 and ∗∗ P < 0.01 compared with the normal rats. # P < 0.05 and ## P < 0.01 compared with CCD rats.