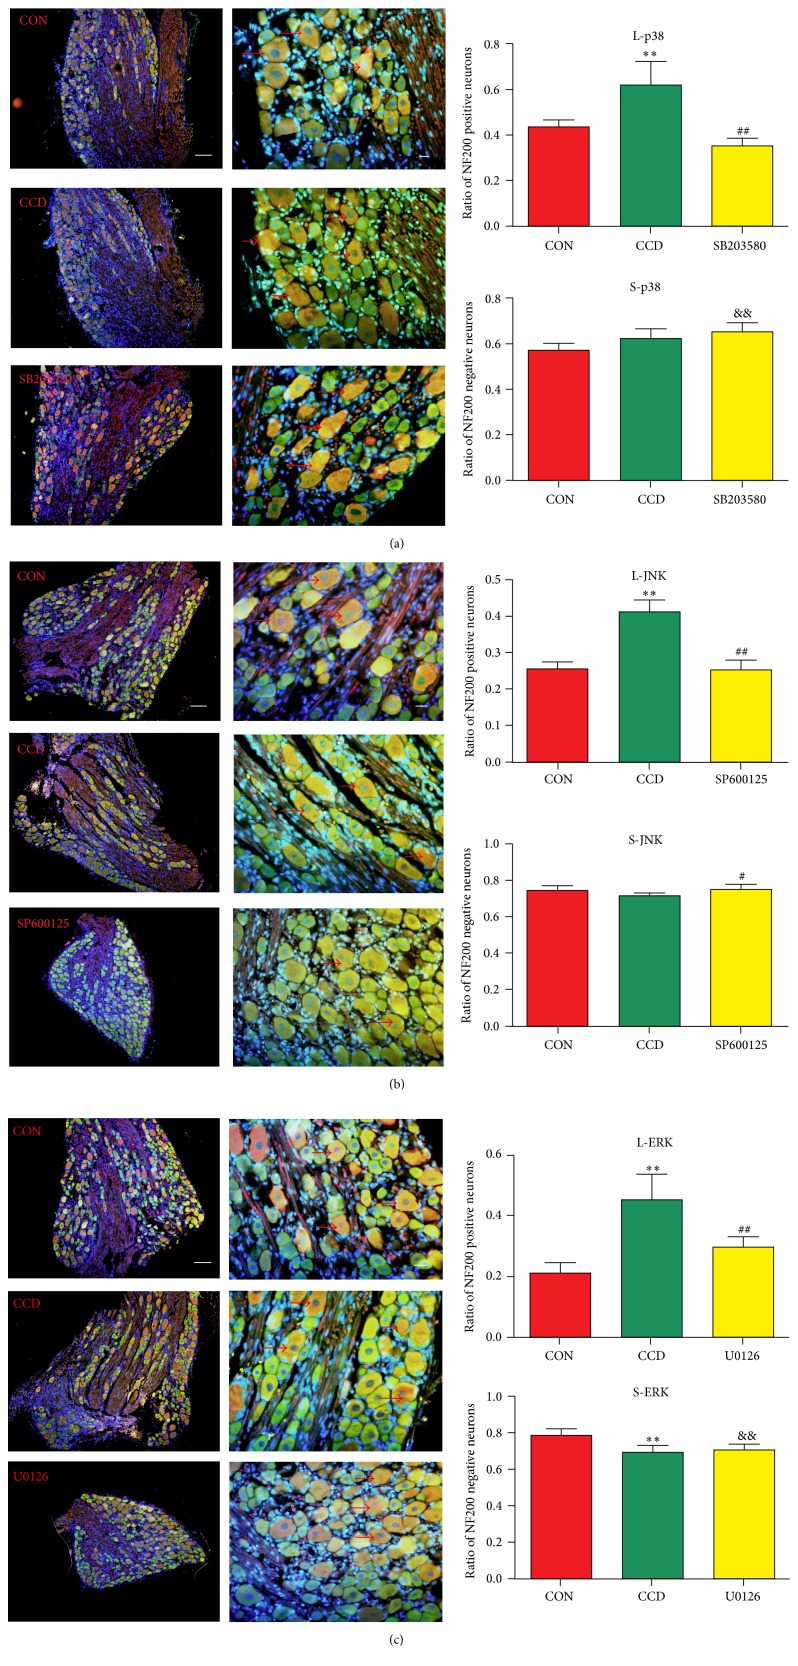
Figure 4.
Changes in the distributions of p38, JNK, or ERK/NF200 positive or negative neurons in the DRG tissue. (a)–(c) illustrate the neuronal distributions and ratios of the NF200 positive or negative neurons. N = 6; ∗ P < 0.05 and ∗∗ P < 0.01 compared with the control group; # P < 0.05 and ## P < 0.01 compared with the CCD group and && P < 0.01 compared with the control group. Scale bars: 100 μm for the low-power field and 20 μm for high-power field (→: NF200 positive neurons).

