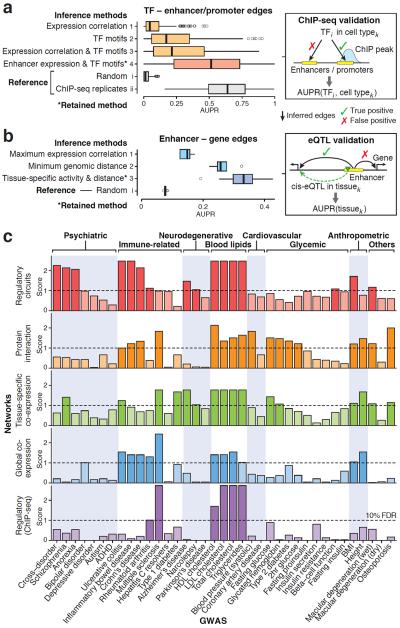
Figure 2. Assessment of regulatory circuits.
(a) Evaluation of different approaches to infer edges between TFs and regulatory elements (enhancers and promoters): (1) standard network inference based on expression correlation between TFs and regulatory elements across samples; (2) presence of TF motifs within regulatory elements; (3) presence of TF motifs, weighted by expression correlation; and (4) presence of TF motifs, weighted by target element expression in the given cell type (the retained method to reconstruct regulatory circuits). For each TF and cell type where ChIP-seq data was available (159 samples, including 59 TFs and five cell lines), the area under the precision-recall curve (AUPR) was computed. As reference, AUPR values were also computed for (i) random data and (ii) replicates of ChIP-seq experiments. Boxplots show the distribution of AUPR values for each method. The retained method (*) achieves a median AUPR of 0.51, which is significantly better than alternative methods (p < 10−15, one-sided Wilcoxon rank-sum test) and the performance is close to that of of ChIP-seq replicates (median AUPR=0.64). (b) Assessment of different approaches to link enhancers to target genes: (1) maximum expression correlation across tissues (assign enhancer to most strongly correlated gene within 500kb); (2) minimum genomic distance (assign enhancer to closest gene); and (3) joint tissue-specific activity (defined as geometric mean of enhancer and gene expression) weighted by genomic distance (the retained method to construct regulatory circuits). AUPR was evaluated for each method as well as random predictions in 13 tissues where eQTL data were available. The retained method (*) has a median AUPR of 0.33, which is significantly better than alternative methods (p < 0.05, one-sided Wilcoxon rank-sum test). Of note, AUPR values are only comparable within each panel, not across panels (a) and (b) because the underlying gold standards are different (Methods). (c) Evaluation of whether trait-associated genes tend to cluster within modules for different types of networks and GWAS traits. Five types of networks are compared: (1) cell type and tissue-specific regulatory networks (the 32 high-level networks defined in Supplementary Fig. 14), (2) four protein-protein interaction networks, (3) 35 tissue-specific co-expression networks15, (4) a global co-expression network inferred from the FANTOM5 data, and (5) a global regulatory network based on ChIP-seq17 (Methods). In addition, tissue-specific regulatory networks based on DNaseI footprints42 were assessed, but did not show any significant enrichment. The plot summarizes whether trait-associated genes are more densely interconnected than expected (maximum connectivity enrichment score) for each network type (row) and trait (column). The scores correspond to the negative log of the q-values. (False discovery rate (FDR) correction was performed separately for each network type to allow for a fair comparison). Rows are ordered based on the overall enrichment (Supplementary Fig. 31a): tissue-specific regulatory networks show the strongest connectivity enrichment. Some traits did not show significant connectivity enrichment, which may be either because the signal was too weak, the relevant tissues were not profiled (e.g., our library does not include pancreatic islet cells relevant for type 2 diabetes9), or other types of networks (e.g., post-transcriptional) may be more relevant for these traits.

