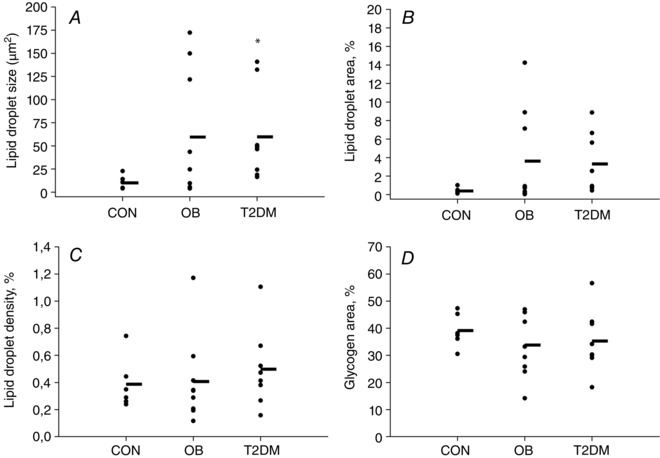
Figure 3. Individual quantitative data on lipid droplets (A–C) and glycogen content (D) in liver biopsies from obese patients with (T2DM) or without (OB) type 2 diabetes and controls (CON) .

LD and glycogen area are defined as the percentage of total tissue area filled by LDs or glycogen, respectively. The horizontal line represents the average value. Results were compared by the Kruskal–Wallis test (lipid droplet size and area) and one‐way ANOVA (lipid droplet density and glycogen area). *Significantly different from CON. Data are the mean ± SEM.
