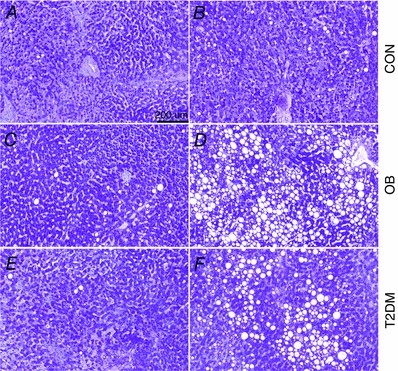
Figure 4. Variation in hepatic lipid content .

Representative images of hepatic PAS staining showing subjects with low (A, C and E) and high (B, D and F) hepatic lipid content in CON (A and B), OB (C and D) and T2DM (E and F).

Representative images of hepatic PAS staining showing subjects with low (A, C and E) and high (B, D and F) hepatic lipid content in CON (A and B), OB (C and D) and T2DM (E and F).