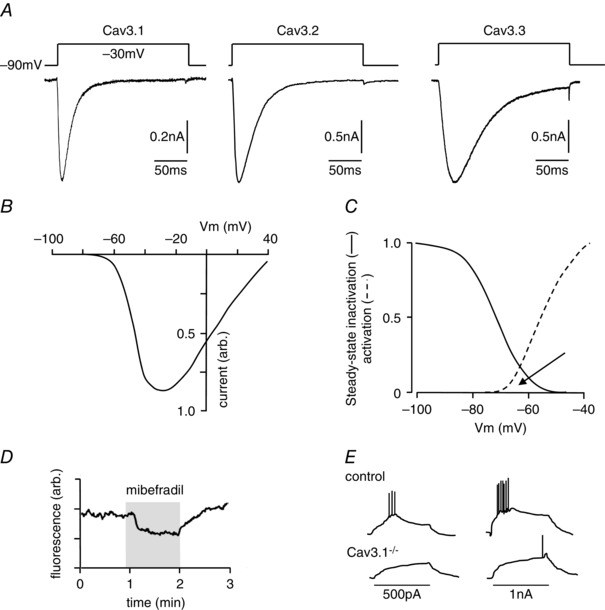
Figure 1. Properties of T‐type Ca2+ channels .

A, example currents evoked by step depolarizations applied (according to the protocol shown above each trace) to HEK293 cells expressing each of the 3 classes of T‐type Ca2+ channel, as indicated. Note the relatively slow activation and inactivation of Cav3.3 as compared with Cav3.1 and Cav3.2. B, schematic current–voltage relationship typical of T‐type Ca2+ channels; note the low threshold for activation. C, superimposition of steady‐state inactivation plot (continuous line) and activation profile (dashed line) typical of T‐type Ca2+ channels. Note the pronounced window current (region of overlap, arrowed). D, fluorimetric recording of [Ca2+]i in a Fura‐2‐loaded HEK293 cell expressing Cav3.2. For the period indicated by the shaded area, the T‐type channel blocker mibefradil (1 μm) was applied, causing a reduction in basal [Ca2+]i (N.T. Hettiarachchi and C Peers, unpublished observations). E, schematic diagram of membrane depolarizations evoked by current injections in thalamic neurones. Note the evoked burst activity is almost fully suppressed in cells lacking the T‐type channel Cav3.1 (see Kim et al. 2001).
