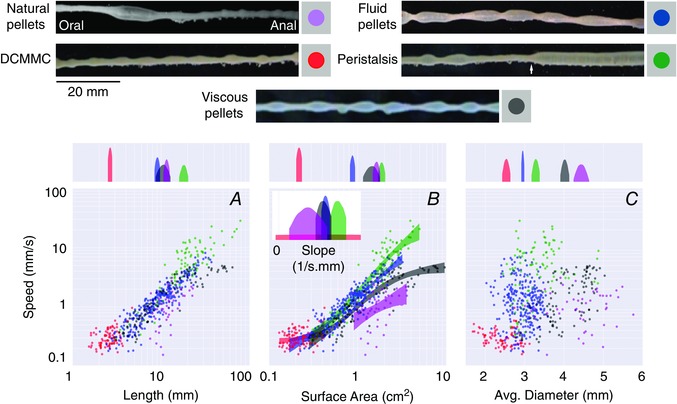
Figure 2. Propulsion of luminal contents is modified by differences in the consistency of luminal contents .

In the upper half of the figure, five different images are shown where boluses of different sizes and shapes (pellets) are present in the distal colon. Natural pellets are represented in purple, distal colonic migrating motor complexes (DCMMCs) in red, fluid pellets in blue, viscous pellets in grey, and peristaltic contractions in green. It was noted that peristaltic contractions often started approximately half‐way along the preparation (white arrow). A–C shows the relationships between speed of propulsion and the bolus size; speed correlates positively with bolus length (A); speed in relation to bolus surface area (B); speed in relation to average bolus diameter (C). In the upper quadrant of each graph (A–C) the probability density is represented on a log scale. The distributions of means are shaded within their 95% highest density interval (HDI, see text) and the gaps between shaded 95% HDIs represent significant differences between the various measures. Note that for the average diameter (C) there is a clear separation between all of the shaded 95% HDIs, indicating that the diameters of different boluses are significantly different from one another. However, a poor correlation exists between the speed of propulsion and average diameter. For surface areas (B) from about 1 cm2, the speeds of all bolus types (except DCMMCs) differ significantly, as shown by the gap between their shaded 95% HDIs (see centre square), with natural, viscous, liquid and peristaltic liquid boluses moving at increasing speeds. The inset in B depicts the distributions of the steepest slope of the sigmoid curve for each bolus type. A shows that a significant overlap exists between the length of the natural, viscous and fluid pellets. DCMMCs (shown in red) are shorter than all other bolus types and peristaltic contractions (shown in green) are significantly longer than all other bolus types. Figure reproduced from Costa et al. (2015), with permission.
