
Figure 4. Power output and pulmonary oxygen uptake during 3 min of all‐out exercise and work‐matched, exhaustive CWR exercise .
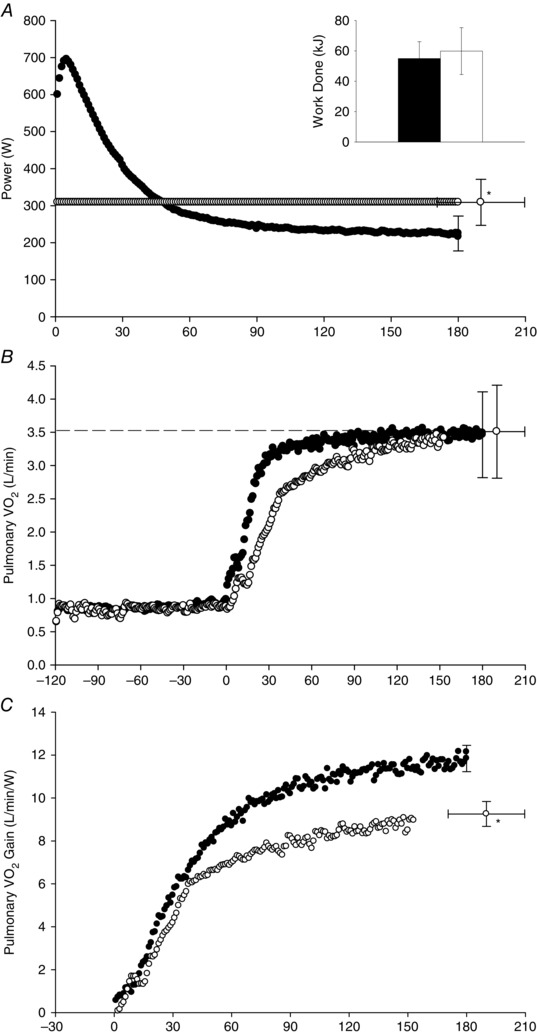
Group mean power output (A), pulmonary (B) and the pulmonary ‘gain’ (C) during the 3 min all‐out test (black symbols and bar) and the work‐matched CWR test (white symbols and bar). The dashed line in (B) indicates the measured in the ramp incremental test. To aid clarity, error bars (SD) are shown for end‐exercise time points only. *Different from the end‐exercise power output (A) and end‐exercise gain (C) in the all‐out test (P < 0.05).