
Figure 6. Time course of 2‐FDG distribution in the liver of wild‐type and Glut2–/– mice .
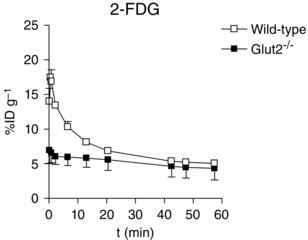
2‐FDG (300 μCi) was administered by tail vein into anaesthetized wild‐type and Glut2–/– mice and the activity in the right lobe of the liver was monitored for 60 min as in the experiments shown in Figs 3, 4, 5. Data are the mean ± SEM for three wild‐type and three Glut2–/– mice.