
Figure 7. Urinary excretion of PET tracers 2‐FDG and Me‐4FDG in wild‐type, Glut2–/–, Sglt1–/– and Sglt2–/– mice .
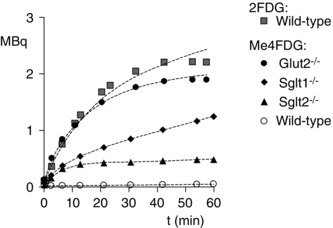
The total amount of 2‐FDG and Me‐4FDG in the urinary bladder of representative WT, Sglt1–/–, Sglt2–/– and Glut2–/– mice as a function of time after i.v. injection of radiotracer (11 MBq) is shown. The data were fit to a three‐compartment model (Fig. 1) using the Kinetic Imaging System (Huang et al. 2005). Fits to the urinary excretion data give glomerular filtration rates between 60 and 120 μl min−1. Estimates of the rate of tubular reabsorption (k 2) for Me‐4FDG were 0.23 ± 0.26 for WT, 0.060 ± 0.03 for Sglt1–/–, 0.09 ± 0.01 for Sglt2–/– and 0.02 ± 0.003 for Glut2–/–; estimates for 2‐FDG were 0.03 ± 0.01 for WT and 0.03 ± 0.02 for Glut2−/− (time‐course not shown). The large error for the estimate of k 2 for the wild‐type mouse is a result of the low level of excretion.