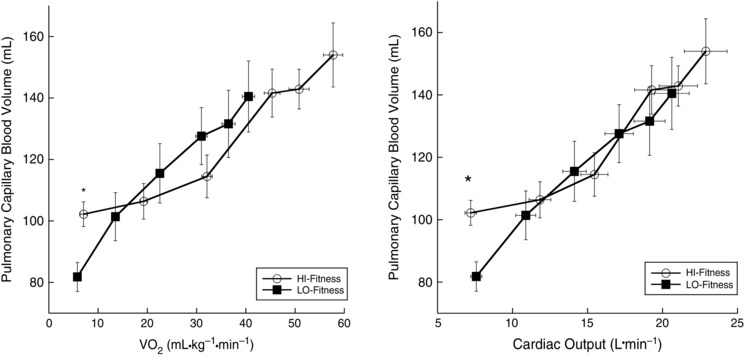
Figure 2. Pulmonary VC response to exercise .

*V C was significantly higher in HI‐Fit subjects compared to LO‐Fit subjects only at baseline (P = 0.005).

*V C was significantly higher in HI‐Fit subjects compared to LO‐Fit subjects only at baseline (P = 0.005).