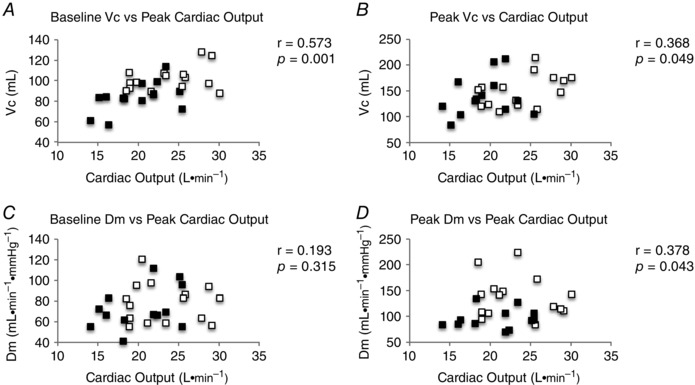
Figure 4. Correlations of individual DM and VC to peak Q .

A, baseline V C. B, V C at 90% . C, Baseline D M. D, D M at 90% . Black squares, LO‐Fit group; white squares, HI‐Fit group.

A, baseline V C. B, V C at 90% . C, Baseline D M. D, D M at 90% . Black squares, LO‐Fit group; white squares, HI‐Fit group.