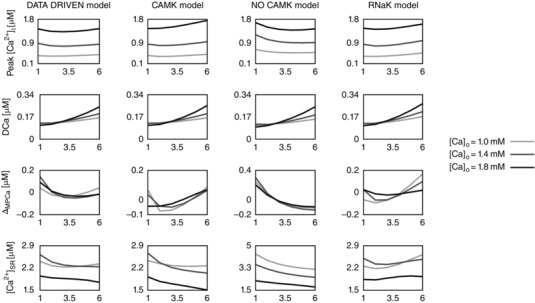
Figure 3. The calcium frequency response (CFR) .

Rate‐dependent changes in peak [Ca2+]i, diastolic [Ca2+]i (DCa), magnitude of peak [Ca2+]i relative variation (ΔMPCa), and Ca2+ in the sarcoplasmic reticulum ([Ca2+]SR) due to changes in the extracellular Ca2+ concentration ([Ca2+]o). Each column represents a different model: the baseline model (DD), a model with inclusion of the CAMKII mediation of LCC and I to activity (CAMK), a model with inhibition of the CAMKII‐mediated increase in SERCA activity (NO CAMK) and a model with reduced Na+/K+ affinity to Na+ (RNaK). Different colours represent different [Ca2+]o: 1.0 mm (light grey), 1.4 mm (dark grey) and 1.8 mm (black).
