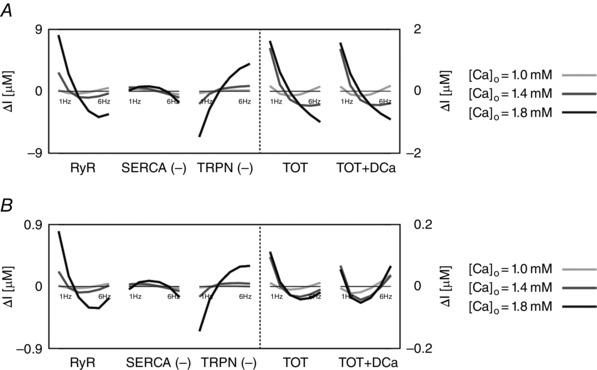
Figure 4. The intracellular and extracellular fluxes behind CFR .

DD model intracellular and extracellular current variation of integrals (ΔI) as a function of frequency (1–6 Hz). A, DD model without rapid calmodulin buffer. B, DD model with rapid calmodulin buffer. In both cases the integrals were evaluated from time = 0 to time = T peak, where T peak is the time to peak of the correspondent simulated Ca2+ transient. Colours represent different extracellular Ca2+ concentrations: 1 mm (light grey), 1.4 mm (dark grey) and 1.8 mm (black). The most important fluxes, plotted in the figure are the following: ryanodine receptors (RyR), Ca2+‐ATPase (SERCA), troponin buffer (TRPN), total current (TOT) and total current plus diastolic Ca2+ (TOT+DCa). The other observed fluxes, L‐type Ca2+ channel (LCC), background Ca2+ current (CaB), reverse mode Na+/Ca2+ exchanger (NCXR), forward mode Na+/Ca2+ exchanger (NCXF), Ca2+ pump (PMCa) and SR leak current (SRl) were one or more orders of magnitude smaller, and therefore we did not include them in the figure.
