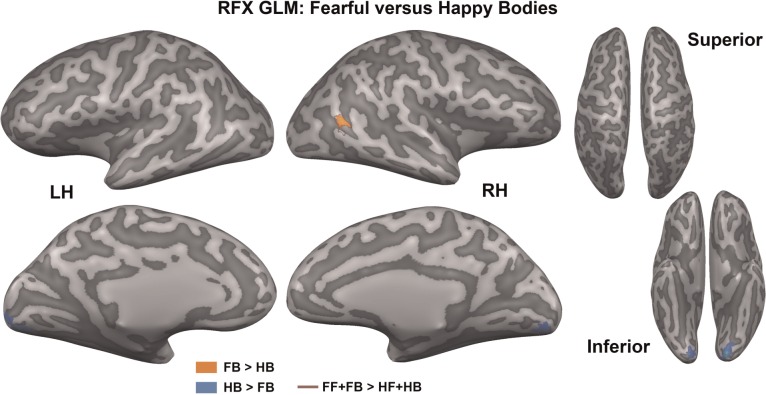
Fig. 5.
Fearful vs happy bodies. The map shows significantly activated voxels (Pcorr < 0.05) for three linear contrasts that compare emotion conditions superimposed on an inflated representation of the cortical sheet: FB > HB (orange), HB > FB (blue) and FF + FB > HF + HB (red outline). FB, fearful bodies, HB, happy bodies; FF, fearful faces; HF, happy faces.

