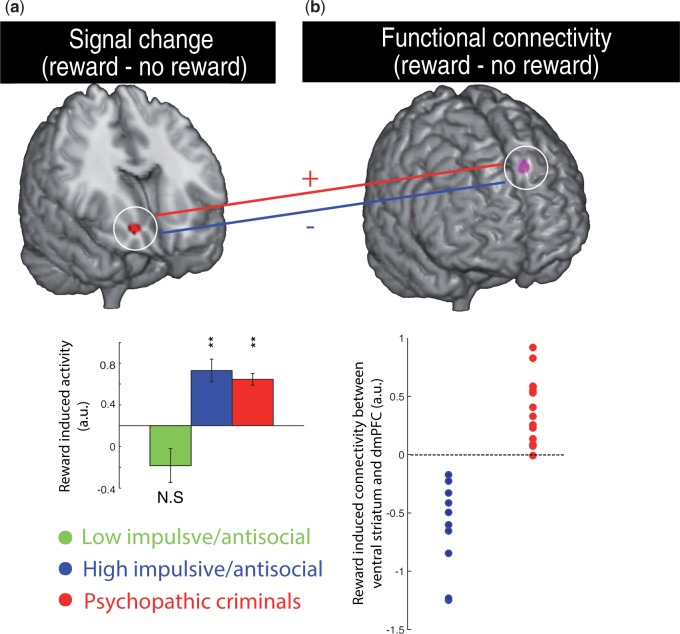
Fig. 2.
(a) Enhanced reward-related BOLD signal in the ventral striatum of psychopathic criminals and healthy noncriminal controls with high antisocial/impulsive traits compared with healthy controls with low antisocial/impulsive traits (peak: MNI xyz [18 22 −8]). Average signal change (reward–no-reward) extracted from the peak cluster is shown for illustrative purposes. (b) BOLD signal in the ventral striatum (3 mm sphere around MNI xyz [18 22 −8]) contributes differentially to the dorsomedial prefrontal cortex (dmPFC) during reward vs no reward expectancy in psychopathic criminals compared with healthy controls with high antisocial/impulsive traits. The scatter plot depicts individual parameter estimates of functional connectivity differences between reward and no reward expectation, extracted from the peak cluster (peak: MNI xyz [−14 34 44]). Images are displayed at a threshold of P < 0.001 uncorrected for illustration purposes.

