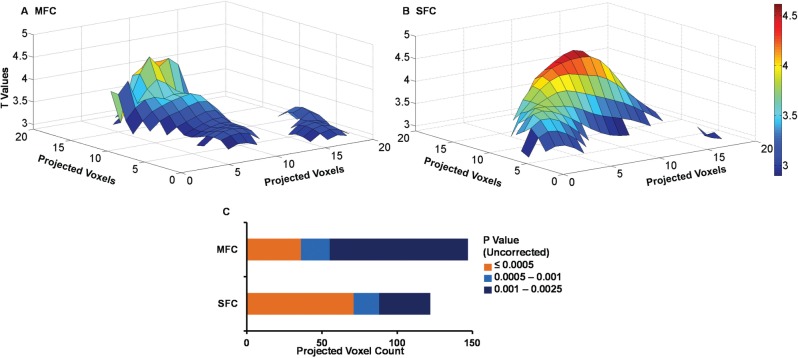
Fig. 3.
Differential intensity distribution of volumetric association with reappraisal in the right MFC (A) compared with the right SFC (B). T-maps for the right MFC and SFC were converted to maximum intensity plots and mapped as surfaces in MATLAB. The matrix values have been thresholded at the critical T value associated with a contrast at P ≤ 0.0025. The x and y axes show projected voxel dimensions, the z axis and the color bar show T values. (C) Projected voxel counts for MFC and SFC. MFC, middle frontal cortex; SFC, superior frontal cortex.

