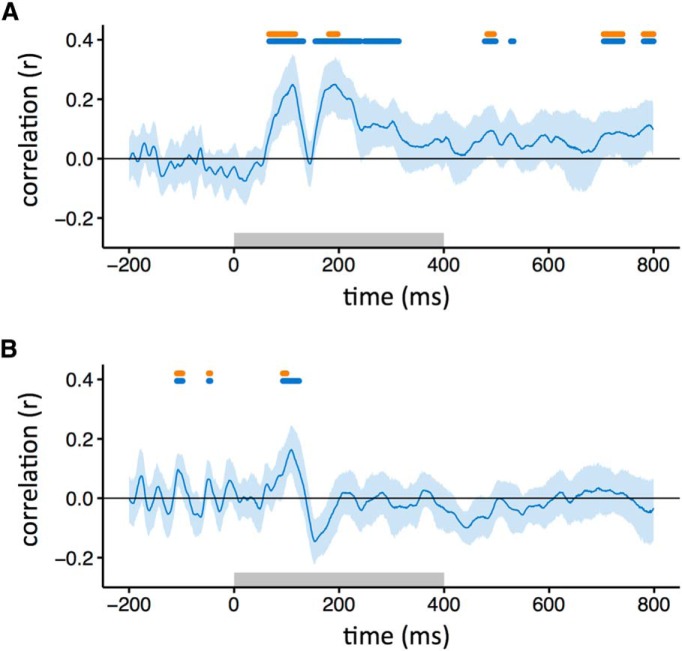
Figure 4.
Similarity between patterns of EEG response to intact images and locally scrambled (A) or globally scrambled (B) images from the same object category. Blue-shaded regions represent 95% CIs across participants. The blue bar at the top of the plot indicates time points at which the correlation is significantly >0. The orange bar indicates the time points at which the correlation is not significantly different from the noise ceiling. The gray box represents the stimulus duration.

