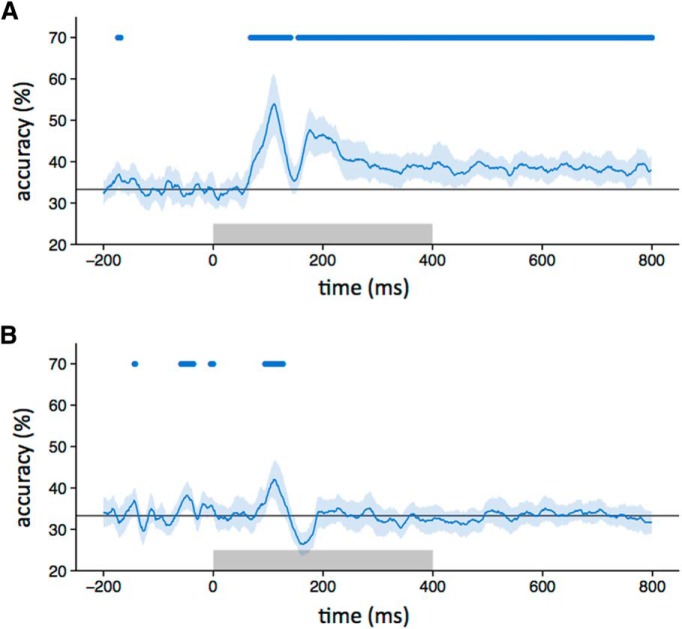
Figure 5.
Classifier performance across different image types. A, Accuracy in classifying responses to either intact or locally scrambled images when trained on locally scrambled or intact images, respectively. B, Accuracy in classifying responses to either intact or globally scrambled images when trained on globally scrambled or intact images, respectively. The blue line indicates classifier accuracy across time, with shaded regions representing 95% CIs obtained through bootstrapping across participants. The blue bar at the top of the plot represents the time points at which the lower bound of the CI is above chance. The gray box shows stimulus duration.

