Figure 5.
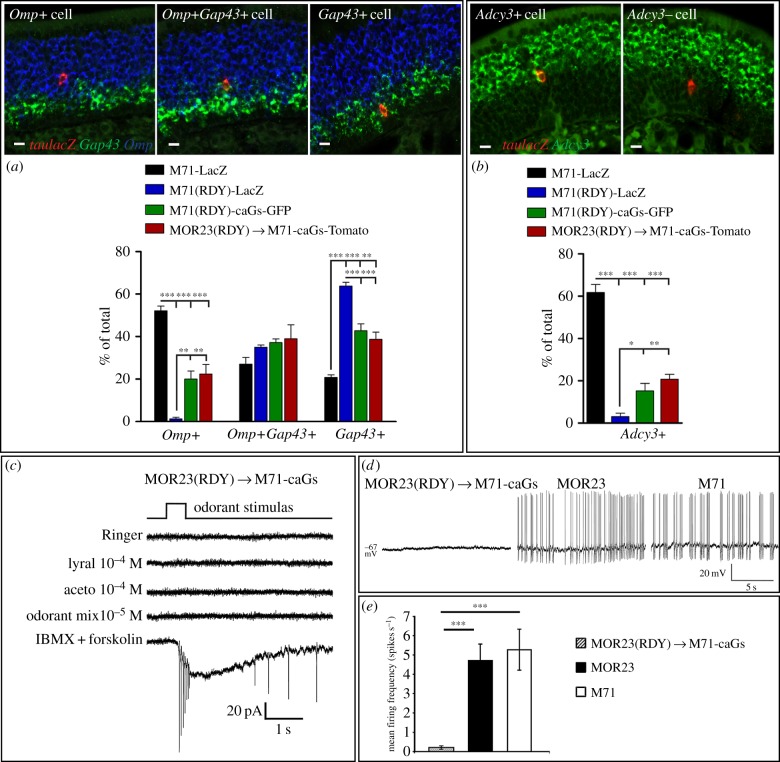
Neuronal maturation and activity are lost in OSNs expressing G-protein coupling mutant ORs. (a) Three-colour ISH on coronal sections of the MOE (PD21). Probes were used against Omp (blue), Gap43 (green) and: taulacZ (red, tau is of bovine origin) for labelling M71-LacZ and M71(RDY)-LacZ OSNs; tauGFP for labelling M71(RDY)-caGs-GFP OSNs; tauTomato for labelling MOR23(RDY) → M71-caGs-Tomato OSNs (red). Examples are shown of a OMP+, OMP+Gap43+ and Gap43+ M71 OSN. The percentage of these populations within the total counted cells (% of total) was quantified at PD21 (mean ± s.e.m., n = 3). (b) Two-colour ISH on coronal sections of the MOE. Riboprobes were used against Adcy3 (green) and OSN markers (red) as explained in (a). Examples are shown for Adcy3+ and Adcy3− M71 OSNs. The percentage of Adcy3+ and Adcy3− OSNs within the total counted cells were quantified at PD21 (mean ± s.e.m., n = 3). (c) Representative traces of patch-clamp recordings in a MOR23(RDY) → M71-caGs OSN under the voltage-clamp mode. Out of 17 recorded OSNs, 13 responded to IBMX+forskolin. However, these cells did not respond to Ringer solution, lyral, acetophenone (aceto) or a mix of odorants. (d) Representative traces of spontaneous activities recorded through perforated patch-clamp in the current clamp mode in MOR23(RDY) → M71-caGs-Tomato or MOR23-GFP or M71-GFP OSNs. Out of 21 recorded MOR23(RDY) → M71-caGs-Tomato OSNs, 14 did not exhibit any spontaneous action potentials. (e) Mean spontaneous firing frequency for MOR23(RDY) → M71-caGs (n = 21), MOR23 (n = 16) and M71 (n = 13) OSNs. Data are mean ± s.e.m. One-way ANOVA and Tukey post test. Scale bars, 10 µm (a,b). One-way ANOVA and Newman–Keuls post test (a,b), *p < 0.05, **p < 0.01, ***p < 0.001.

