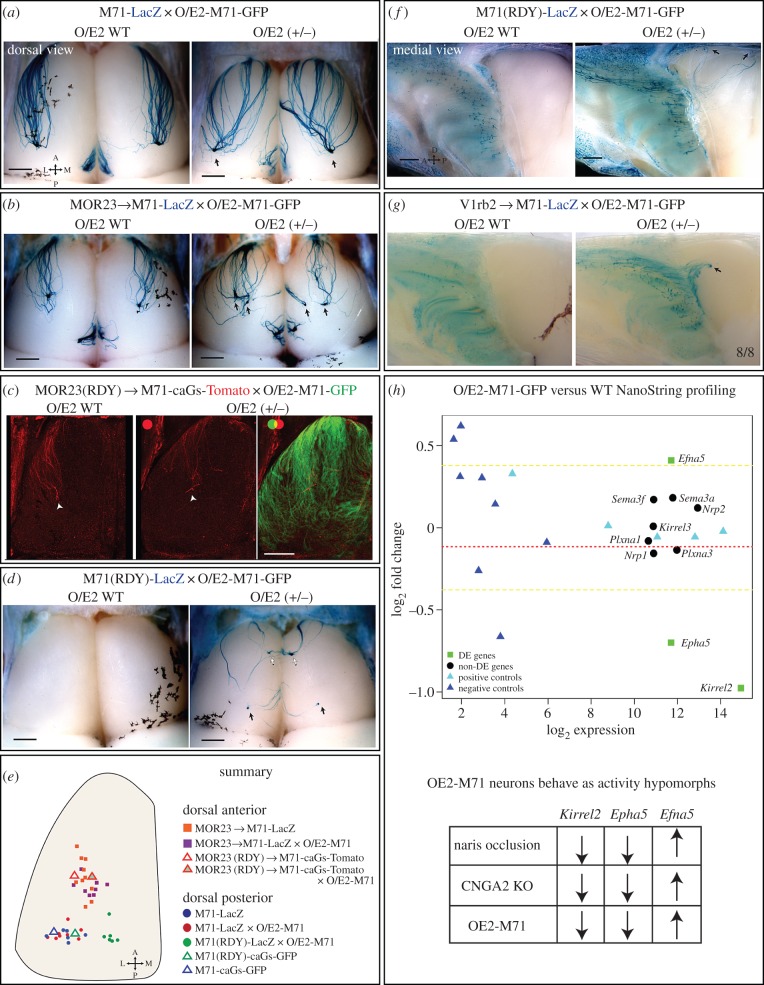
Figure 9.
O/E2-M71-GFP rescue experiments show that the anterior–posterior targeting of M71 OSNs is not correlated with the levels of G-protein signalling. (a,b,d,f,g) Wholemount X-gal staining of dorsal or medial bulbs of the indicated crosses (PD10–PD21). Images on the left are control O/E2 WT littermates, on the right are O/E2-M71-GFP+/− heterozygous animals. Arrows highlight glomeruli and axonal projections, respectively. White arrows in (d) indicate ectopic anteromedial glomeruli. M71 mutations: (a,b,g) heterozygous; (c,d) homozygous. (c) Wholemount intrinsic GFP and Tomato fluorescence of the dorsal bulb. Arrow indicates the projection site of lateral MOR23(RDY) → M71-caGs axons (red). O/E2-M71-GFP intrinsic fluorescence is shown in green. (e) Schematic diagram of the dorsal bulb. Coloured dots represent approximate coordinates of individual lateral glomeruli of the indicated strains. Triangles represent the A-P domain to which the caGs expressing OSNs of the indicated strains project. (h) NanoString RNA analysis of whole olfactory mucosa samples collected from six WT and six O/E2-M71-GFP heterozygous littermates (PD25). The y-axis represent the log2 of the fold change of mutant versus WT (i.e. M value), the x-axis represents the log2 of the normalized NanoString counts. To test for significance tTreat analysis was used, with a fold change threshold set at 1.1. Differentially expressed genes are indicated as green squares. Red stippled line: the average M value of all tested OR genes. For reference, the yellow stippled lines are set at a fold change of 1.3 (or 0.38 in log2 scale). Positive controls (cyan triangles) and negative controls (blue triangles) for NanoString operation are distributed correctly as per manufacturer. As indicated in the table, the changes in Kirrel2, Epha5 and Efna5 gene expression in O/E2-M71-GFP mice resemble the published gene expression changes in CNGA2 KO and naris occluded animals. Scale bars, 500 µm.

