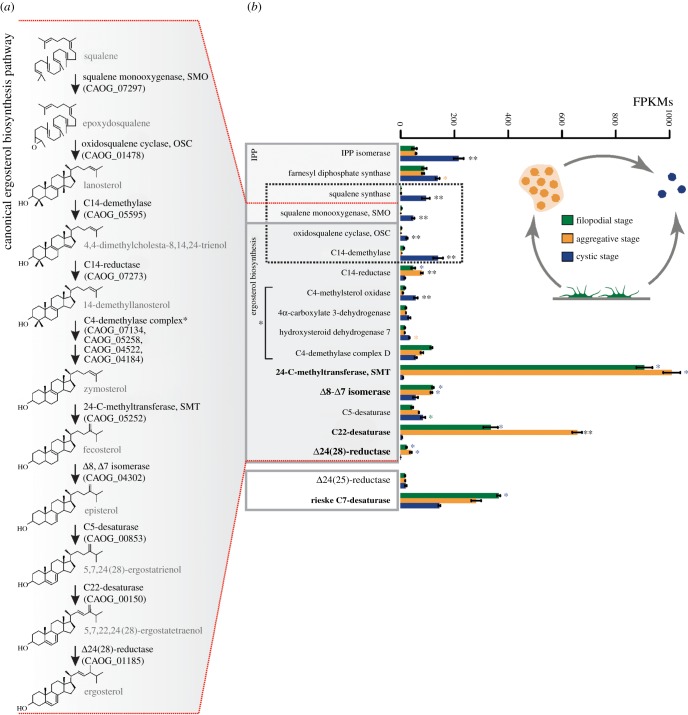
Figure 3.
(a) Canonical ergosterol synthesis pathway [30]. Identities of the C. owczarzaki orthologues of the enzymes involved in each step are indicated in parentheses. (b) Expression profile of sterol metabolism genes obtained from RNAseq data [28]. Barplot represents the average of normalized FPKM values for each gene at the three different life cycle stages. Genes coding for the enzymes involved in the first steps of de novo sterol synthesis are highlighted by a dashed box. Enzyme members of the C4-demethylase complex are indicated by a square bracket. Asterisks indicate the gene is significantly differentially expressed in both (two asterisks) or only one (one asterisk) pairwise comparison (aggregative versus filopodial and aggregative versus cystic). Bars show standard error.

