Figure 2.
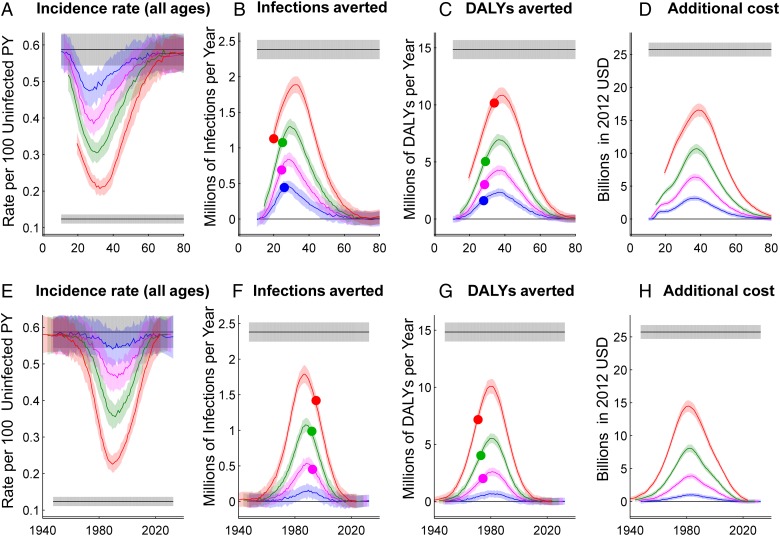
Effect of age-targeted treatment expansion on HIV incidence, cumulative infections averted, cumulative disability-adjusted life years (DALYs) averted, and cumulative program cost. Effects of the interventions are represented on the y-axis, with x-axes showing the middle of the age group being targeted (panels A–D) or middle birthdate of the birth cohort being targeted (panels E–H). The inclusion criteria of the targeted groups span 20 (red), 10 (green), 5 (magenta) or 2 (blue) years. Shaded areas show one standard deviation of 20 stochastic simulations. Incidence is shown at 20 years after the intervention begins, and other outcomes are accumulated over the first 20 years with a 3% annual discount rate. At the left and right extremes of each plot, the curves converge to black lines showing the baseline (no intervention) scenario, which projects current guidelines and trends in HIV treatment. The opposite black line shows universal treatment expansion with 80% coverage of annual testing for all individuals. Dots in panels B and F show the strategy with the minimum cost per infection averted over 20 years. Dots in panels C and G show the strategy with the mimumum cost per DALY averted.

