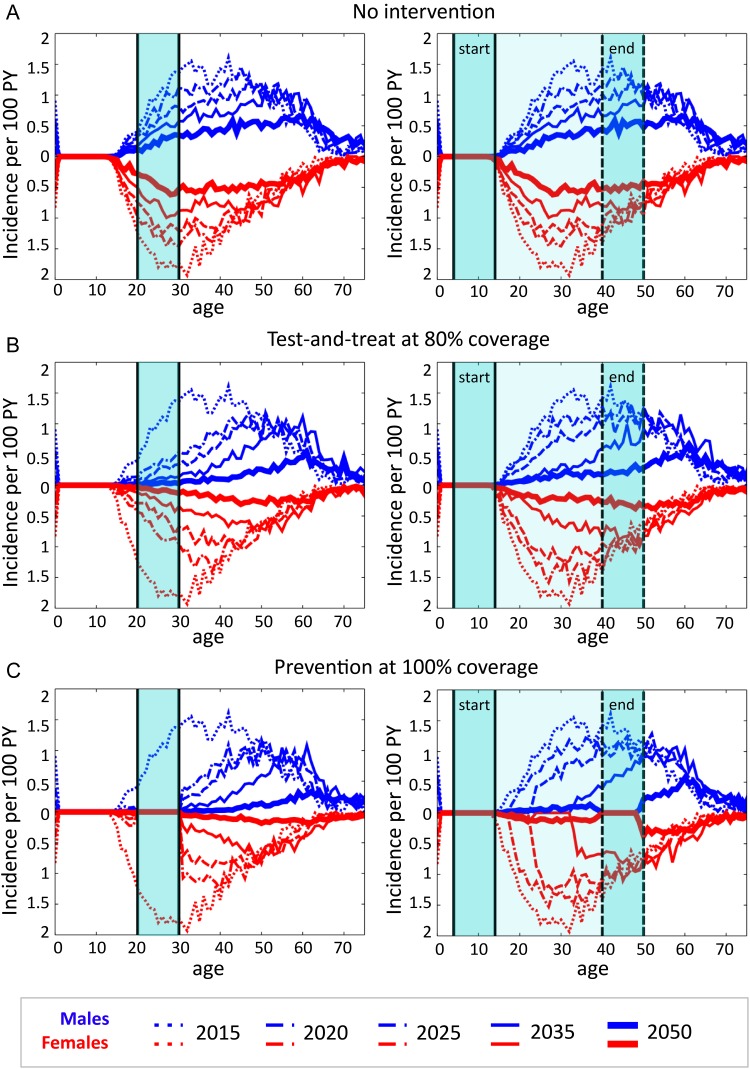
Figure 3.
Age distribution of HIV incidence for the baseline simulation (A), targeted treatment outreach (B), and targeted complete prevention of HIV infection (C). Incidence is shown just before implementation of the intervention, and at 5, 10, 20 and 35 years after implementation of the intervention. Shaded areas show the age range of the target group throughout the intervention (left) or for a birth cohort in the year of implementation (‘start’) and 35 years after implementation (‘end’). Age-dependent incidence per 100 uninfected person-years (PY) was averaged across 20 stochastic simulation runs.

