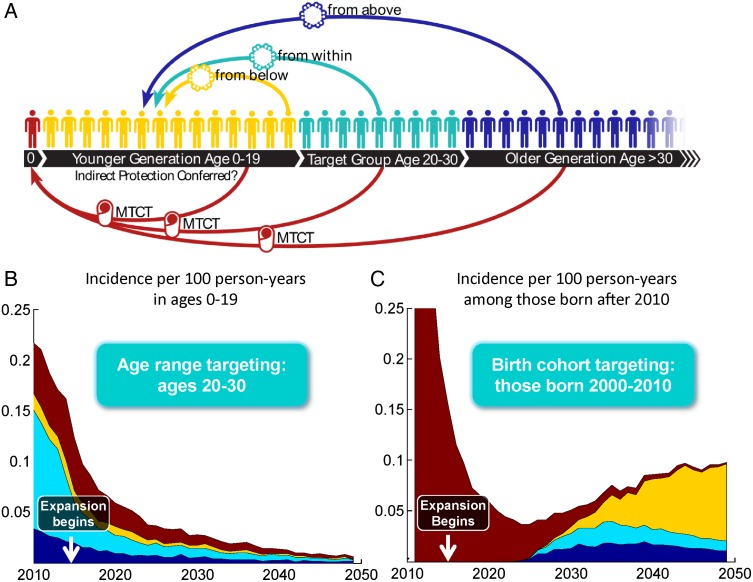
Figure 4.
Sources of new HIV infections in the generation younger than the target group. The diagram in panel (A) shows how infections can enter the younger generation from those older than the target group (blue), those in the target group (teal), those already infected in the younger generation itself (yellow), or through mother-to-child transmission from any age group (maroon). The contribution of each of these sources to incidence in those younger than the target group is shown in panel (B) for age targeting and panel (C) for birth cohort targeting. The denominator for incidence in (B) is the uninfected population ages 0 through 19. In (C), the denominator is the population of uninfected individuals with a birthdate after 2010, which grows over time as new individuals are born.

