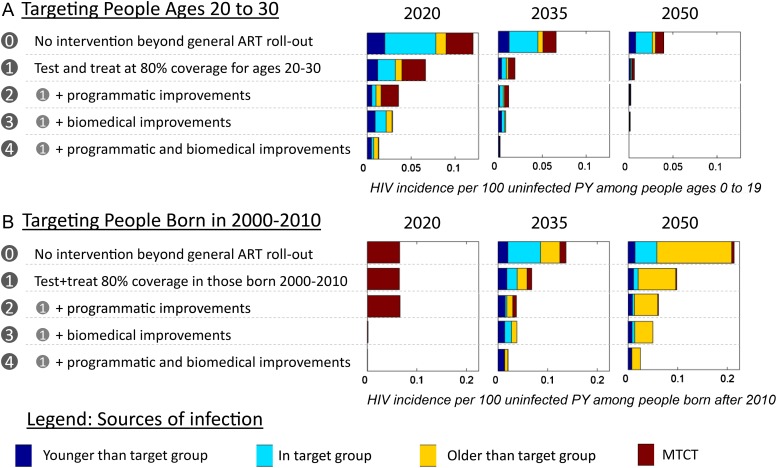
Figure 5.
Impact of biomedical or programmatic improvements on the sources of new HIV infections in the generation younger than the target group. Stacked bar charts show the rate of new HIV infections in future generations, defined as those younger than the targeted (A) age range or (B) birth cohort. New infections are color-coded by their source, with possible contributors being those older than the target group (blue), those in the target group (teal), those already infected in the younger generation itself (yellow), and mother-to-child transmission from any age group (maroon). The projections are shown for general ART roll-out without any specific intervention for the target group (0), achieving 80% coverage of annual testing and ART for all new diagnoses in the target group (1), further programmatic improvements in treatment as prevention the target group (2), further biomedical improvements (3), and a combination of programmatic and biomedical improvements (4). The individual components of programmatic and biomedical improvements are not shown here, but are compared in Supplementary Figure 1.

