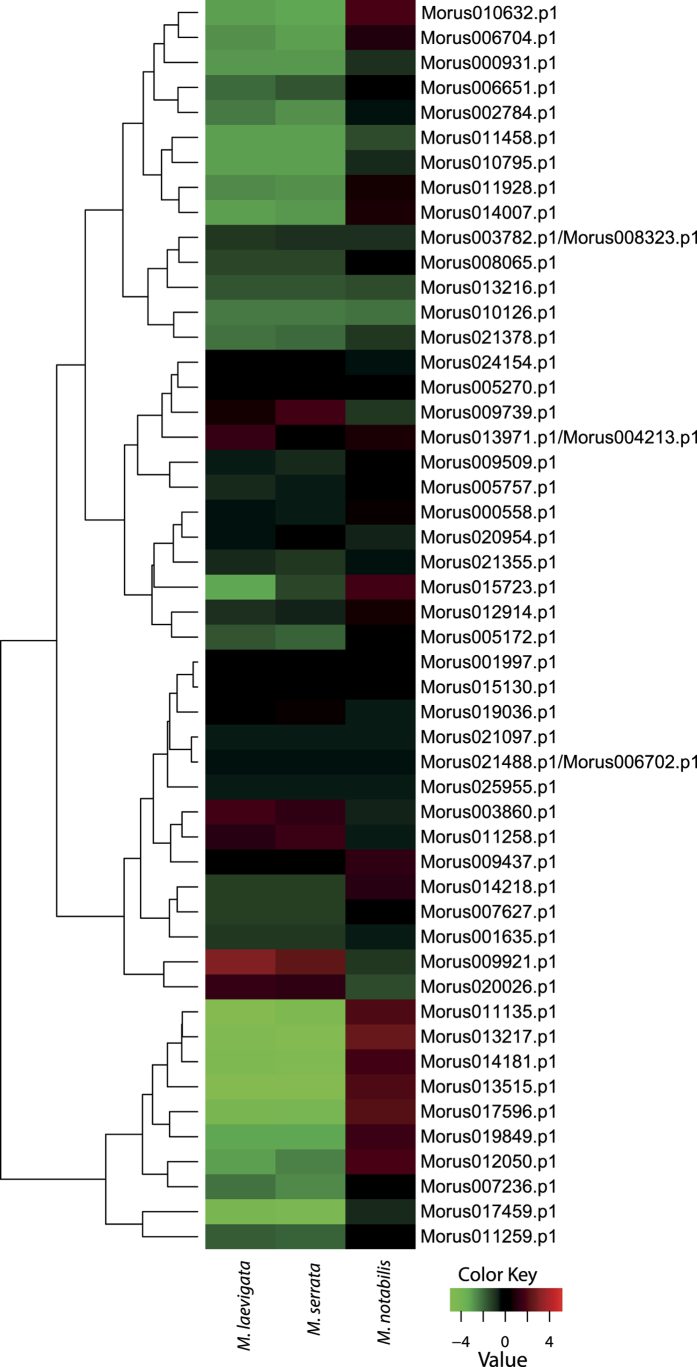
Figure 5. Heat map showing the comparative expression level of WRKY genes in three genotypes i.e., Morus laevigata, Morus serrata, and Morus notabilis.
Genes with comparatively lower expression values are shown using shades of green and high expression values are represented using shades of red. TMM-normalized FPKM values were used to generate the heat map.

