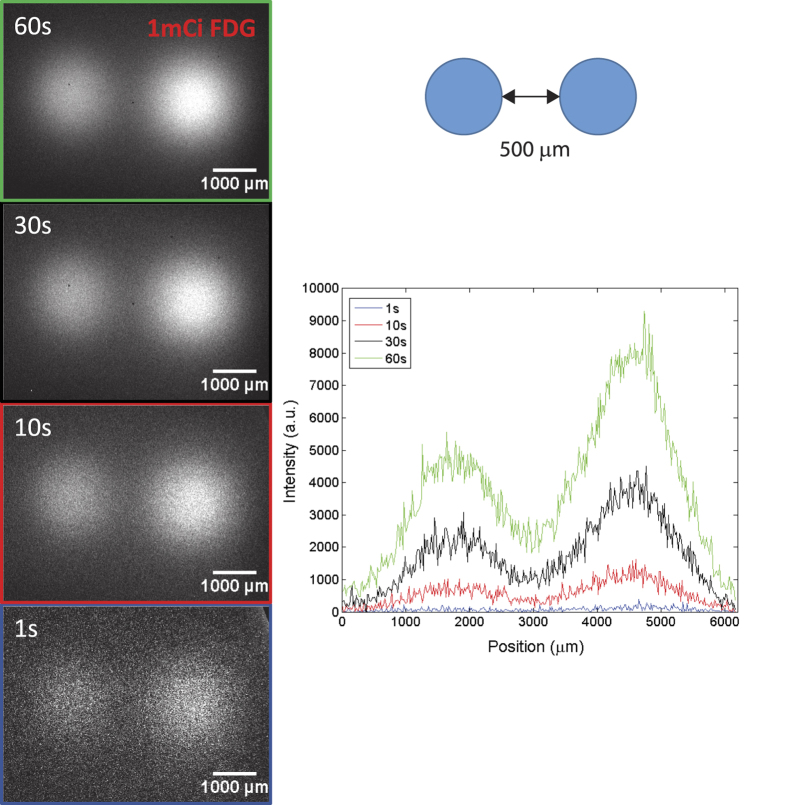
Figure 3. Resolution of the LRI endoscope.
Series of images from two dried drops of FDG (1 μCi), which are separated by 500 μm at different acquisition times (tacq). The line scan along the row of the maximum pixel is shown for the different tacq using the color code in the image frames. Both spots can be resolved down to an tacq of 1 s.

