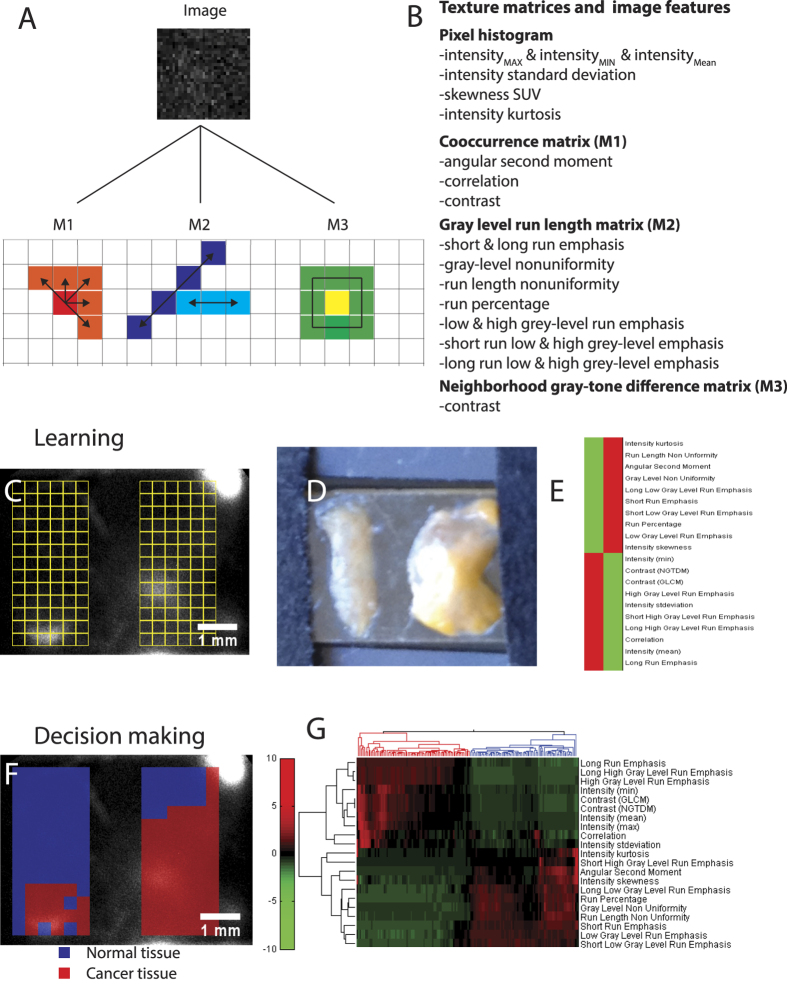
Figure 6. Machine vision for the classification of tumor and benign tissue.
(A) 22 image features are used for classification. All features are calculated from the global image (pixel histogram) or one of three types of image matrices (M1–3) that capture local and regional features. (B) Image matrices and 22 associated features used for classification. (C,D) LRI endoscope with a tissue slice culture of normal kidney (left) and renal cancer (right). Selected ROIs on both samples are shown in yellow. Small ROIs are 20 by 20 pixels. (E) Computed and clustered image features for all ROIs show the image features that are larger in the tumor in red (Mean C) and larger in normal tissue (Mean N). (F) Automated classification of small ROIs using clustering of image features knowing which parameter are larger in the tumor or normal tissue from (C). (G) Clustering result of the small ROIs with normal (blue) or tumor (red). Seventeen out of 78 ROIs are misclassified in the normal and in the cancer tissue.

