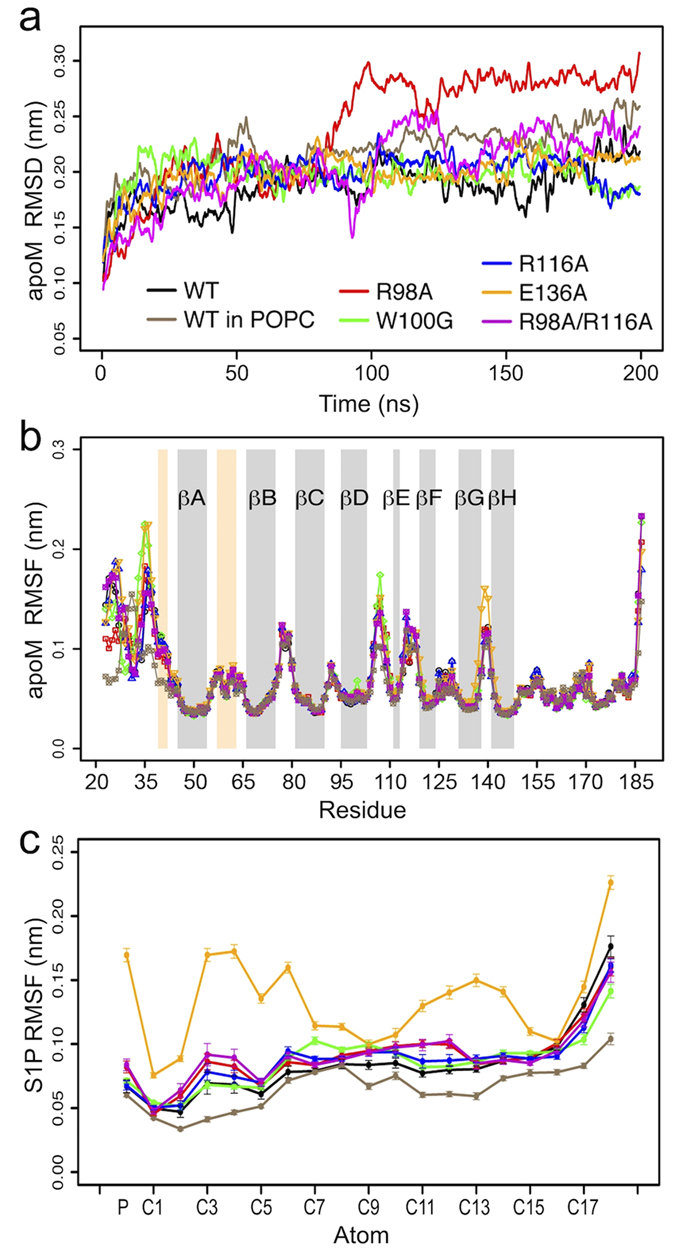
Figure 4. Stability and fluctuations of apoM and S1P.

RMSD (a) and RMSF (b) values of apoM were analyzed for the Cα-atoms of the seven studied complexes (WT, black; WT attached to POPC, brown; R98A, red; W100G, green; R116A, blue; E136A, orange; R98A/R116A, magenta). The values were averaged over 40 windows of 5 ns length each. Error bars show the standard error. (c) RMSF values of the phosphorus atom and carbon atoms of S1P. The values were averaged over 20 windows of 10 ns length each. Error bars show the standard error.
