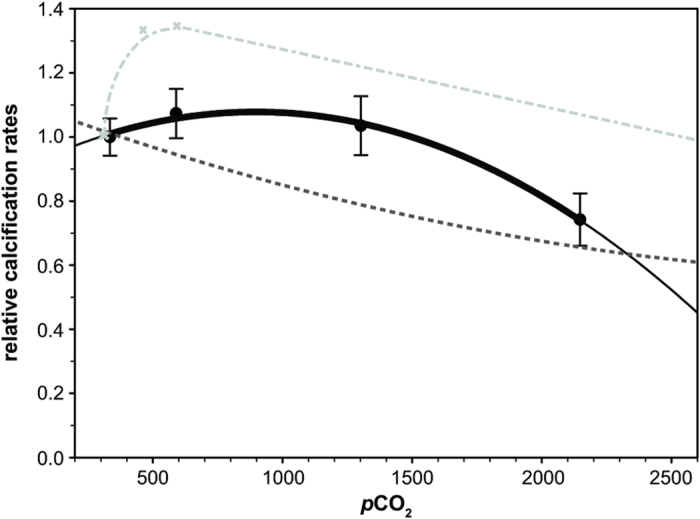
Figure 3. Growth response modelled for massive Porites corals at the Papua New Guinea seeps.

The modelled growth response displays relative changes in calcification rate (relative calcification rate = mean control/mean site). Black circles and error bars represent means ±1 SE per site and the black solid line indicates a second-order polynomial fit for the growth model in this study. The growth response curve is compared to published growth responses: McCulloch et al.19 (dark grey dashed line) and Castillo et al.24 (light grey dashed line).
