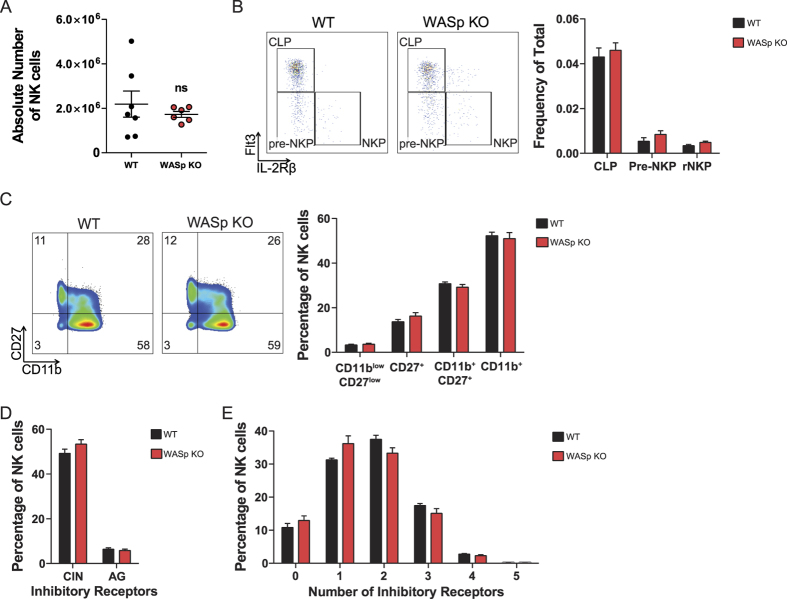
Figure 2. WASp KO NK cells develop and are educated normally.
(A) NK cell number. The absolute number of NK1.1+CD3− NK cells in the spleen of WT and WASp KO mice, from a pool of 2 individual experiments. Each dot represents one mouse. WT n = 7, WASp KO n = 6. (B) NK cell development in the bone marrow. CD19−CD11b−Ly6D−NK1.1−CD3−c-Kit−2B4+CD27+IL-7Rα+ bone marrow cells were used to define the 3 different NK cell precursor populations; CLP, Pre-NKP and NKP cells, based on Flt3 and IL-2Rβ expression. The analysis is a pool of 2 individual experiments. WT n = 6, WASp KO n = 6. (C) NK cell development assessed with markers CD11b and CD27. The analysis is a pool of 3 individual experiments. WT n = 10, WASp KO n = 11. (D,E) Analysis of the inhibitory receptor repertoire to assess NK cell education in WASp KO mice, from a pool of 2 individual experiments. WT n = 4, WASp KO n = 6. (D) The number of NK cell inhibitory receptors reacting to self or non-self MHC class I in C57Bl/6 hosts. The two classes of inhibitory receptors; CIN = Ly49C, Ly49I and/or NKG2A, AG = Ly49A and/or Ly49G2. NK cells that express any of the combinations between both group CIN and AG (C + A, C + G, I + A, I + G, N + A, N + G, CI + A, CI + G, IN + A, IN + G, CN + A, CN + G, CI + AG, IN + AG, and CN + AG) are not shown. (E) The number of different inhibitory receptors per NK cells. Graphs show mean values ± SEM. Significance was assessed with the Mann-Whitney test and found not significant when comparing WT and WASp KO values. ns = not significant. Abbreviations: CLP; Common Lymphoid Progenitor, Pre-NKP; Pre-NK cell Progenitor, NKP; NK cell progenitor.

