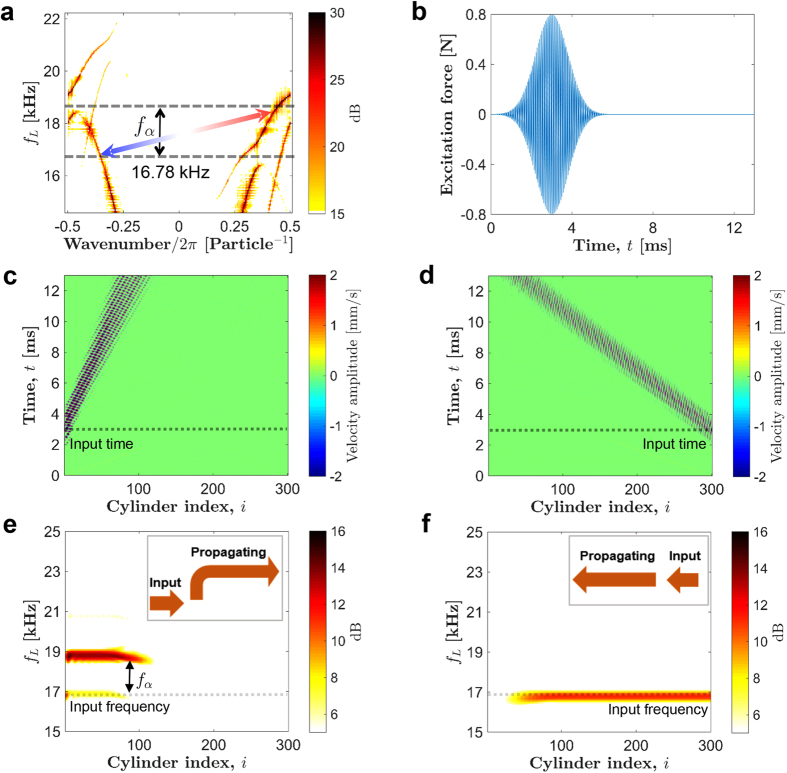
Figure 5. Implication of asymmetric band-gaps.
(a) A zoomed view of the highest band-gap 3 in the dispersion curve at fα = 2 kHz. System’s response is examined at input excitation frequency fα = 16.78 kHz. The arrow tips denote leftward and rightward propagating frequencies indicating inter-band transition. (b) Gaussian profile of the input force that is applied at the ends of the cylinder chain. (c,d) Spatio-temporal map of cylinder velocity when signal is sent from the left (right) end of the chain. (e,f) The corresponding frequency content of the propagating pulse. We observe that rightward travelling pulse propagates with a higher frequency (slower speed) compared to that of input pulse, however leftward propagating pulse does not see any such frequency shift (insets for summary).

