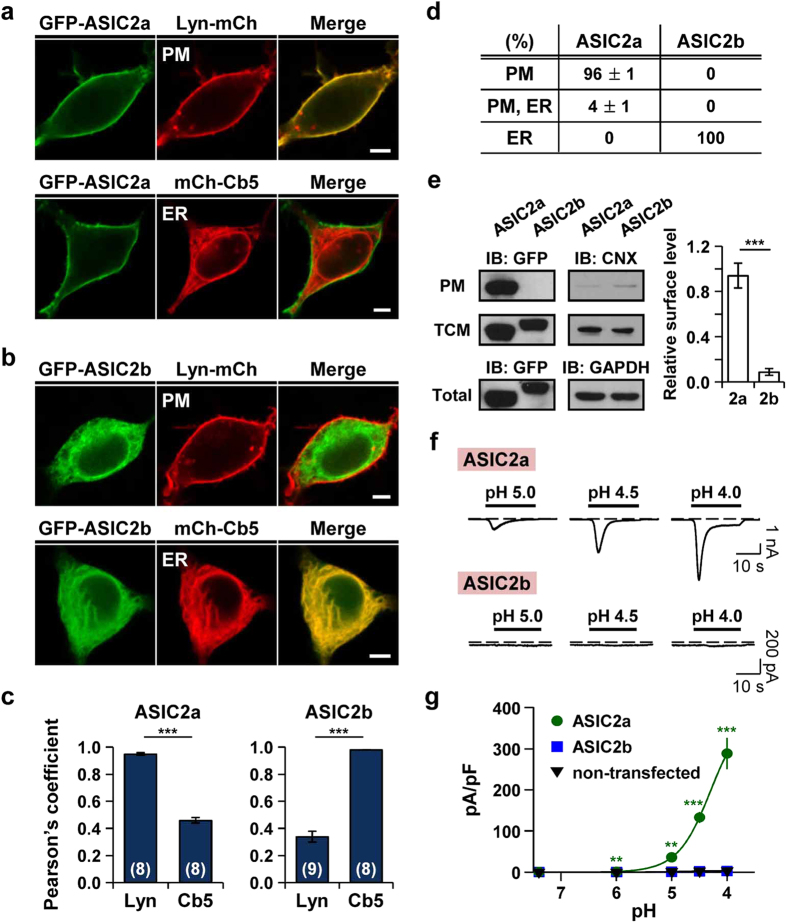
Figure 1. Different subcellular localization and proton-sensitivity between ASIC2a and ASIC2b in HEK293T cells.
(a,b) Representative confocal images of HEK293T cells expressing (a) ASIC2a or (b) ASIC2b with a plasma membrane (Lyn-mCh) or ER (mCh-Cb5) probe. ASIC2a is co-localized with the plasma membrane marker, while ASIC2b is co-localized with the ER marker. The scale bar represents 5 μm. (c) Pearson’s correlation coefficient denoting co-localization of fluorescent images was calculated (mean ± SEM, ***p < 0.001, with Student’s two-tailed unpaired t-test). The number on each bar indicates n for each condition from three independent experiments. (d) Percentage of cells showing each subunit in specific subcellular localizations was obtained by manually counting cells co-transfected with a plasma membrane or ER probe (mean ± SEM). For each subunit, 250 cells were counted from five independent experiments. (e) Left, Western blotting on the plasma membrane (PM) fraction, total cellular membrane (TCM) fraction, and total lysate of cells expressing GFP-tagged ASIC2a or ASIC2b was performed using anti-GFP antibody. As controls, the PM and the TCM fractions were blotted using anti-calnexin (CNX) antibody, and total lysate was blotted using anti-GAPDH antibody. Right, the PM expression was normalized to the TCM expression (n = 5 for each, mean ± SEM, ***p < 0.001, with Student’s two-tailed unpaired t-test). (f) Proton-activated currents in HEK293T cells expressing ASIC2a (top) or ASIC2b (bottom). Rapid extracellular pH drop to indicated values from 7.4 generated the currents in cells expressing ASIC2a, while the cells expressing ASIC2b generated no currents. The time interval between pH applications is 2 min for a complete recovery from desensitization. Dashed line indicates the zero current level. (g) pH-dependent peak current density (mean ± SEM, **p < 0.01, ***p < 0.001, with Student’s two-tailed unpaired t-test compared to non-transfected). The current density of ASIC2a is increased with decreasing pH value of extracellular solution. (ASIC2a, n = 5; ASIC2b, n = 5; non-transfected, n = 6).

