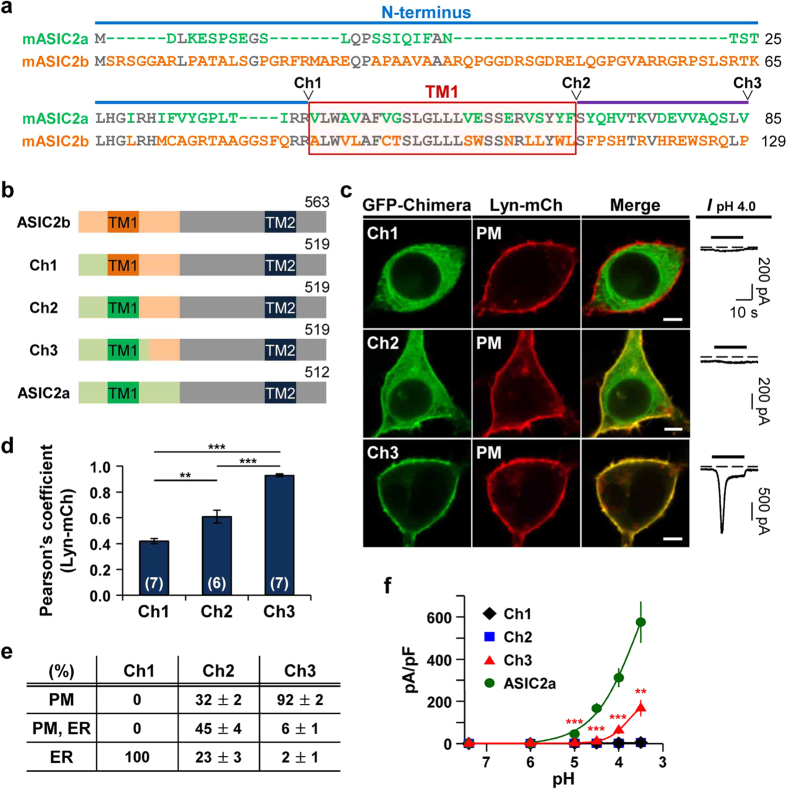
Figure 2. Replacement of the first 129 amino acids in ASIC2b by corresponding regions of ASIC2a conferred surface expression and proton-sensitivity.
(a) Sequence alignment of ASIC2a (1–85 amino acids) and ASIC2b (1–129 amino acids). Blue and purple lines indicate the N-terminus and the extracellular loop region, respectively. The TM1 domain is denoted by a red box. Conserved residues between two subunits are in gray. In ASIC2b, 1–86 amino acids (aa) were replaced by 1–42 aa of ASIC2a (Ch1), 1–112 aa were replaced by 1–68 aa of ASIC2a (Ch2), and 1–129 aa were replaced by 1–85 aa of ASIC2a (Ch3). (b) Schematic diagram of constructed chimeras. (c) Left, representative confocal images of HEK293T cells expressing each chimera with the PM marker, Lyn-mCh. The scale bar represents 5 μm. Right, pH 4.0-induced currents measured from the cells expressing each chimera. Dashed line indicates the zero current level. (d) Pearson’s correlation coefficient between the PM marker and each chimera (mean ± SEM, **p < 0.01, ***p < 0.001, with one-way ANOVA followed by Bonferroni post-hoc test). The number on each bar indicates n for each condition from three independent experiments. (e) Percentage of cells showing each chimera in specific subcellular localizations (mean ± SEM). For each chimera, 250 cells were counted from five independent experiments. (f) pH-dependent peak current density of each channel (mean ± SEM, **p < 0.01, ***p < 0.001, with Student’s two-tailed unpaired t-test compared to ASIC2a). The time interval between pH applications is 2 min for a complete recovery from desensitization (Ch1, n = 5; Ch2, n = 6; Ch3, n = 5; ASIC2a, n = 5).

