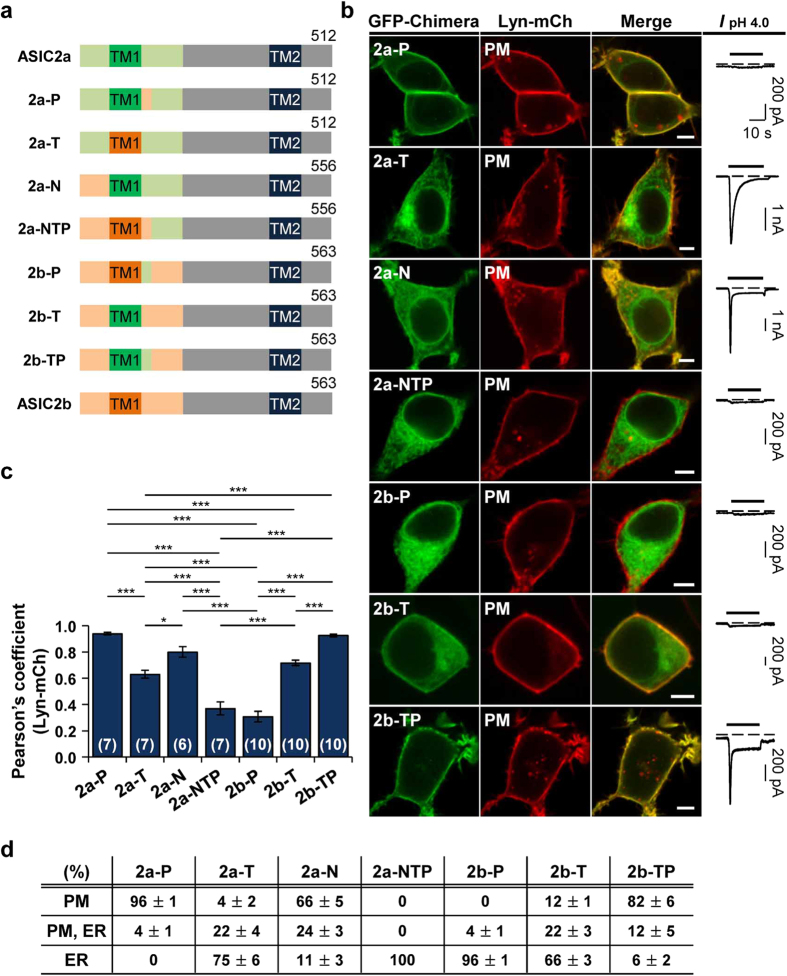
Figure 3. The TM1 and the proximal post-TM1 domain of ASIC2a are critical regions for surface trafficking of ASIC2.
(a) Schematic diagram of constructed chimeras. (b) Left, representative confocal images of HEK293T cells expressing each chimera with the PM marker, Lyn-mCh. The scale bar represents 5 μm. Right, pH 4.0-induced currents measured from the cells expressing each chimera. Dashed line indicates the zero current level. (c) Pearson’s correlation coefficient between the PM marker and each chimera (mean ± SEM, * p < 0.05, ***p < 0.001, with one-way ANOVA followed by Bonferroni post-hoc test). The number on each bar indicates n for each condition from three independent experiments. (d) Percentage of cells showing each chimera in specific subcellular localizations (mean ± SEM). For each chimera, 250 cells were counted from five independent experiments.

