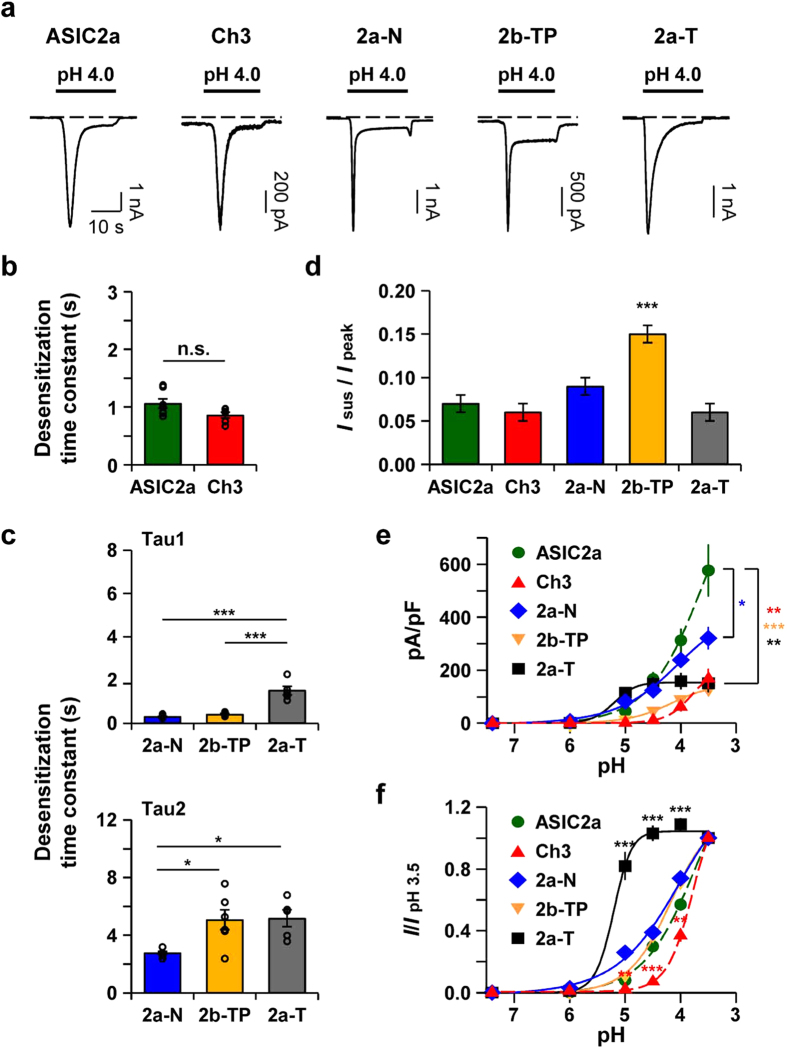
Figure 4. The N-terminus and the TM1 domain regulate the channel properties.
(a) Representative current traces from cells expressing each channel. Dashed line indicates the zero current level. (b) Time constant (τ) for desensitization at pH 4.0 was calculated by fitting the current in a single exponential function (mean ± SEM, n.s.; not significant). (c) Time constants (τ) for desensitization at pH 4.0 were calculated by fitting the current in a double exponential function (mean ± SEM, * p < 0.05, ***p < 0.001, with one-way ANOVA followed by Bonferroni post-hoc test). When Area1 and Area2 represent the area of τ1 and τ2, respectively, Area1/Area2 values were 0.91 ± 0.11 (n = 6) for 2a-N, 1.40 ± 0.10 (n = 6) for 2b-TP, and 0.26 ± 0.06 (n = 5) for 2a-T. (d) Ratio of sustained current to peak current at pH 4.0 (mean ± SEM, ***p < 0.001, with Student’s two-tailed unpaired t-test compared to ASIC2a). (e) pH-dependent peak current density of each channel (mean ± SEM, * p < 0.05, **p < 0.01, ***p < 0.001, with Student’s two-tailed unpaired t-test compared to ASIC2a). The time interval between pH applications is 2 min for a complete recovery from desensitization. For 2a-N and 2b-TP, pH-dependent response was measured from individual cells. pH-dependency curves of ASIC2a and Ch3 from Fig. 2f were plotted as controls (dashed line). (ASIC2a, n = 5; Ch3, n = 5; 2a-N, n = 5 at each point; 2b-TP, n = 6 at each point; 2a-T, n = 6). (f) Normalized pH-dependency curves in Fig 4e. Peak current at each pH was divided by pH 3.5-evoked peak current (mean ± SEM, **p < 0.01, ***p < 0.001, with Student’s two-tailed unpaired t-test compared to ASIC2a).

