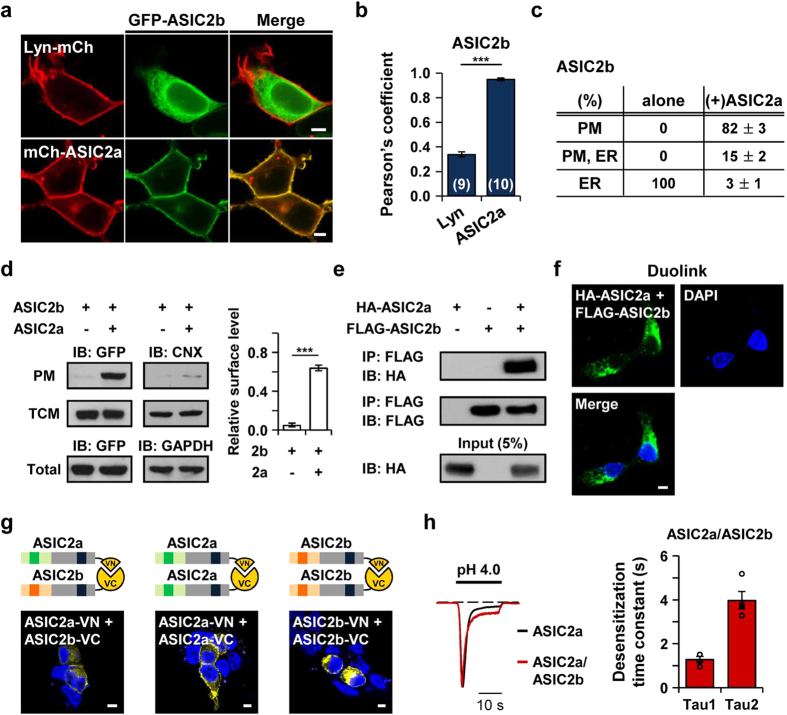
Figure 6. ASIC2b traffics to the cell surface by heteromeric assembly with ASIC2a.
(a) Representative confocal images of HEK293T cells co-expressing ASIC2b with the plasma membrane marker (top) or ASIC2a (bottom). (b) Pearson’s correlation coefficient between ASIC2b and Lyn or ASIC2a (mean ± SEM, ***p < 0.001, with Student’s two-tailed unpaired t-test). The number on each bar indicates n for each condition from three independent experiments. (c) Percentage of cells showing ASIC2b in specific subcellular localizations in the absence or presence of ASIC2a (mean ± SEM). For each experiment, 250 cells were counted from five independent experiments. (d) Left, Western blotting on the plasma membrane (PM) fraction, total cellular membrane (TCM) fraction, and total lysate of cells expressing GFP-tagged ASIC2b with or without ASIC2a in pcDNA3.1(+) was performed using anti-GFP antibody. As controls, the PM and the TCM fractions were blotted using anti-calnexin (CNX) antibody, and total lysate was blotted using anti-GAPDH antibody. Right, the PM expression was normalized to the TCM expression (n = 3 for each, mean ± SEM, ***p < 0.001, with Student’s two-tailed unpaired t-test). (e) Co-immunoprecipitation assay in HEK293T cells co-expressing HA-ASIC2a and FLAG-ASIC2b. (f) Duolink PLA. Intense PLA signal was detected in HEK293T cells co-expressing HA-ASIC2a and FLAG-ASIC2b. (g) Schematic diagram of BiFC assay and confocal images of HEK293T cells expressing each combinatory construct. VN and VC are N- and C-terminal fragments of the Venus protein, respectively. Venus signals were examined for heteromerization of ASIC2a and ASIC2b, and homomerization of ASIC2a or ASIC2b. The fluorescent signals of BiFC were detected, as indicated by a yellow color. (h) Representative current traces of ASIC2a homomeric channel (black) and ASIC2a/ASIC2b heteromeric channel (red) were superimposed. Dashed line indicates the zero current level. Desensitization time constants (τ) of ASIC2a/ASIC2b current at pH 4.0 were calculated by fitting the current in a double exponential function (mean ± SEM). When Area1 and Area2 represent the area of τ1 and τ2, respectively, Area1/Area2 values were 1.39 ± 0.42 (n = 4). The scale bar represents 5 μm.

