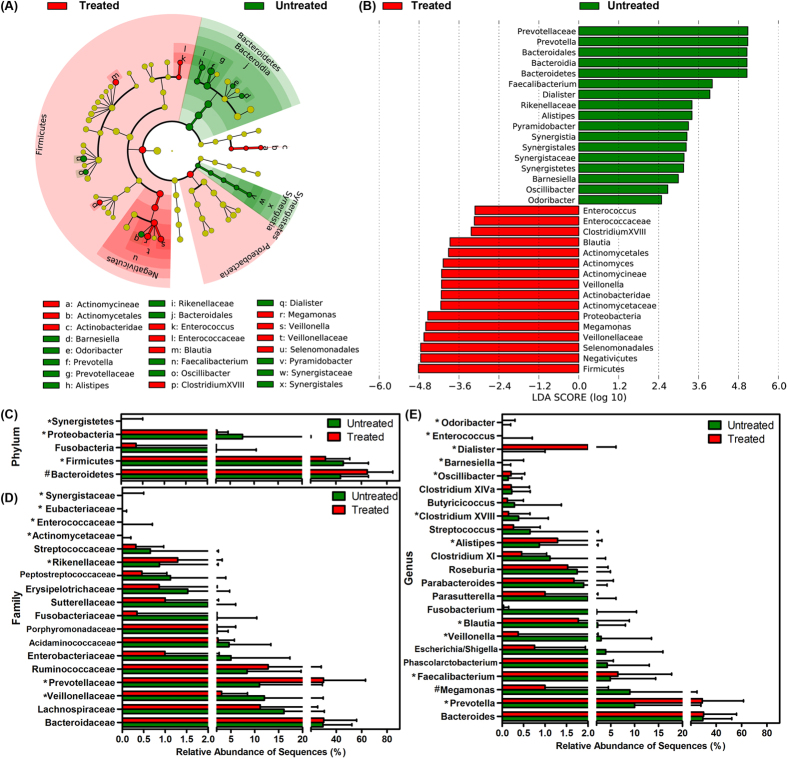
Figure 3. Taxonomic differences between the fecal microbiota of treated and untreated HIV-1-infected subjects.
Cladogram represents the features that are discriminative with respect to HAART using the LDA model results for the bacterial hierarchy (A). LDA coupled with effect size measurements identified the most differentially abundant taxa between the two groups (B). Comparisons of the relative abundance at the level of bacterial phylum (C), family (D) and genus (E) between treated and untreated HIV-1-infected subjects; *P < 0.05; #P < 0.01.

