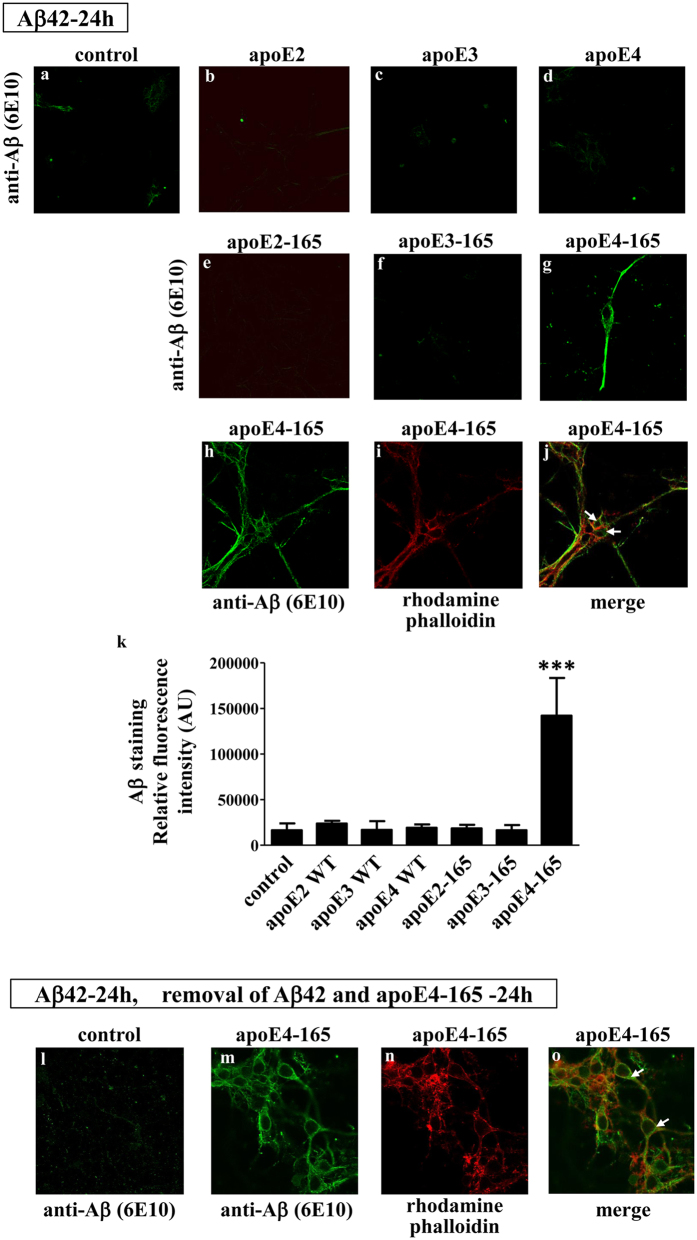
Figure 3. Fluorescence confocal laser scanning microscopy of primary mouse cortical neurons incubated in the presence of Aβ42 and full-length apoE or truncated apoE-165 forms.
Primary mouse cortical neurons were incubated with 25 ng/ml Aβ42 in the absence (control) or presence of 375 nM lipid-free full-length apoE or apoE-165 forms for 24 h, as indicated in each panel (a–j). Primary mouse cortical neurons were also incubated with 25 ng/ml Aβ42 in the absence (control) or presence of 375 nM lipid-free apoE4-165 for 24 h and then washed and incubated further in fresh medium without Aβ42 or apoE4-165 for 24 more hours, as indicated (l-0). Aβ immunostaining of cells was detected with the antibody 6E10 followed by a FITC-conjugated secondary antibody (a-h, l, m, green). F-actin was stained with rhodamine phalloidin (i, n, red). The merge of images h, i and m, n is shown in panels j and o, respectively. The quantitation of Aβ42 staining in mouse cortical neurons, incubated with 25 ng/ml Aβ42 in the absence (control) or presence of 375 nM lipid-free full-length apoE or apoE-165 forms for 24 h, based on relative fluorescence intensity measurements is shown in panel k. Values are the means ± SD (n = 4–8). ***p < 0.0001 vs control; AU: arbitrary units. Two images for each experimental condition (i.e. incubation of primary mouse cortical neurons with 25 ng/ml Aβ42 in the absence (control) or presence of 375 nM lipid-free full-length apoE or apoE-165 forms for 24 h) showing the Aβ immunostaining of cells are presented in Supplemental Figure 1. In addition, F-actin staining of cells using rhodamine phalloidin or greyscale images of increased brightness/contrast are shown in Supplemental Figure 1, to facilitate the visualisation of cells outline, especially in the images with very low Aβ immunostaining.

