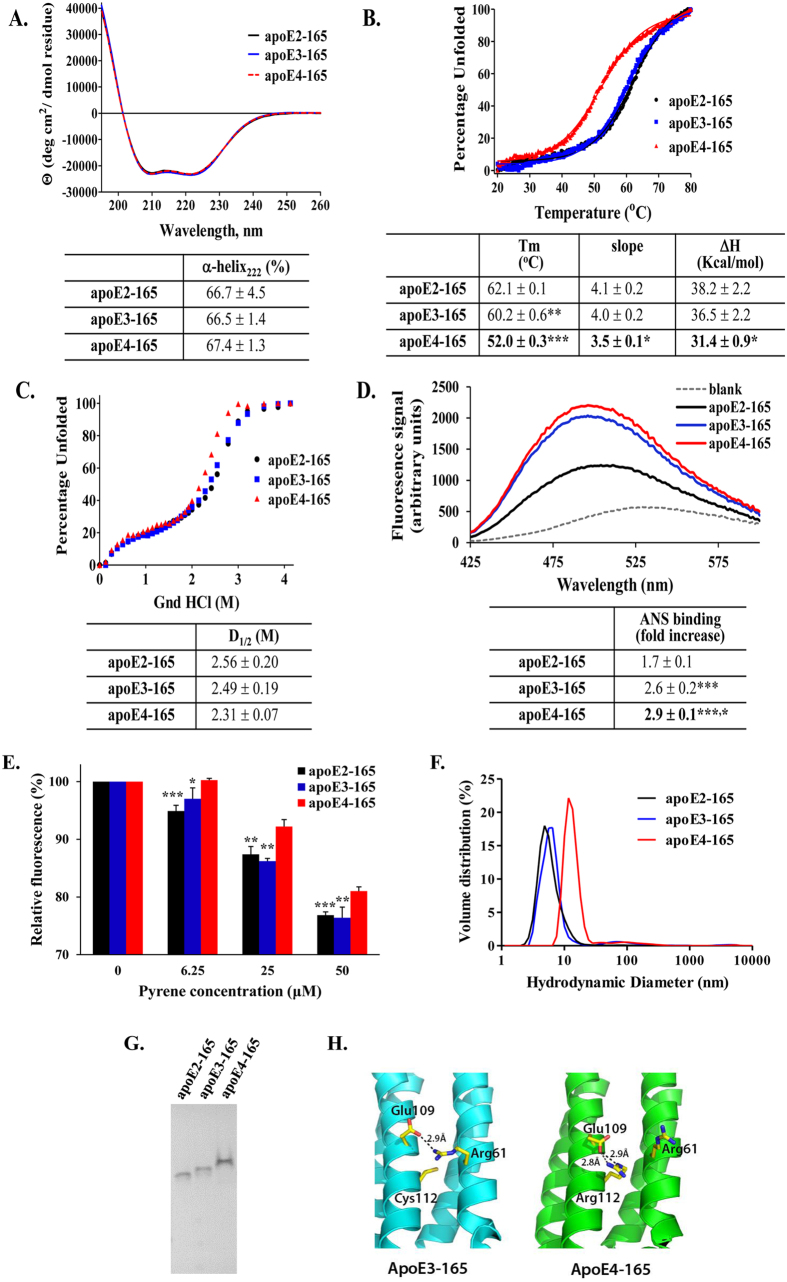
Figure 6. Physicochemical properties of truncated apoE-165 forms.
(A) Far UV circular dichroism spectra of apoE-165 forms. Spectra are averages of three separate experiments. The % helical content was calculated based on the molar ellipticity at 222 nm as described under “Methods”. (B) Thermal denaturation profiles of apoE-165 forms. Y-axis has been normalized to correspond to the percentage of the protein in the unfolded state. Experimental data were fit to a simple two-state Boltzman transition (solid line). Apparent Tm and ΔH values were calculated as described under “Methods”. “Slope” is the calculated slope of the linear component of the thermal denaturation transition around Tm. Tm: **p < 0.005 apoE3-165 vs apoE2-165, ***p < 0.0001 apoE4-165 vs apoE2-165 and apoE3-165; slope: *p < 0.05 apoE4-165 vs apoE2-165 and apoE3-165; ΔH: *p < 0.05 apoE4-165 vs apoE2-165 and apoE3-165 (C) Chemical denaturation profiles of apoE-165 forms. Y-axis has been normalized to correspond to the percentage of the protein in the unfolded state. Apparent D1/2 values were calculated as described under “Methods”. (D) ANS fluorescence spectra in the presence or absence of apoE-165 forms. Spectra are the average of three separate measurements. Fold-increase is the increase in ANS fluorescence in the presence of the protein relative to free ANS in the same buffer. ***p < 0.0001 apoE4-165 and apoE3-165 vs apoE2-165, *p < 0.05 apoE4-165 vs apoE3-165 (E) Tryptophan fluorescence of apoE-165 forms in the presence of increasing concentrations of pyrene is shown relative to the fluorescence in the absence of pyrene (set as 100%). Values are the means ± SD of four experiments. *p < 0.05, **p < 0.005, ***p < 0.0001 for apoE2-165 or apoE3-165 vs apoE4-165 (F) Volume-normalized particle distribution profiles of apoE-165 forms, measured by DLS. (G) Native 15% PAGE analysis of apoE-165 forms. The gel was stained with Coomassie Brilliant Blue. Mobility differences between alleles are consistent with changes to overall protein charge due to the allelic background. (Η) Schematic representation of the differences in salt-bridge interactions between helices 2 and 3 in apoE3-165 and apoE4-165 based on the crystal structures of apoE3-165 (pdb code 1OR3) and apoE4-165 (pdb code 1GS9).

