
Figure EV1. Prevalence and transcript levels of var genes encoding specified PfEMP1 features.
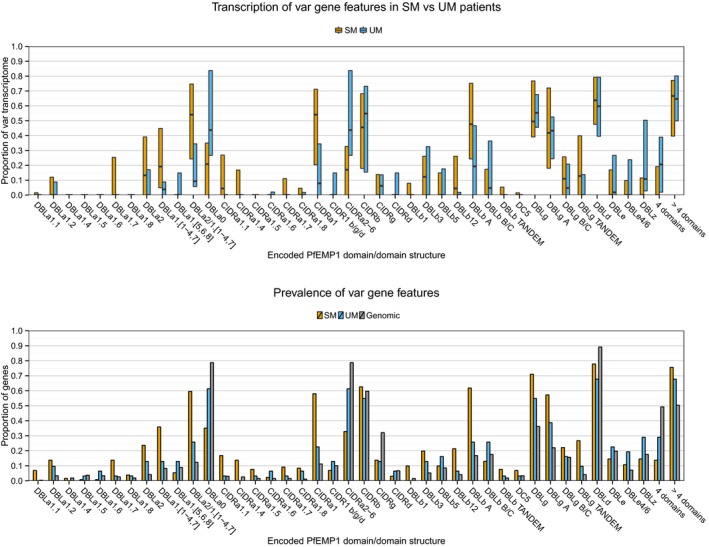
Upper panel: Patient‐wise var transcript proportions of encoded domain types/domain compositions, compared by patient group [uncomplicated malaria (UM), n = 8 and severe malaria (SM), n = 36]. Boxplots show median and IQR. Lower panel: Proportion of transcripts/genes encoding specific domain types/domain compositions within patient groups [UM (n = 31 genes), SM (n = 131 genes)] and the average Plasmodium falciparum genome [distribution based on seven genomes (n = 268 genes)].